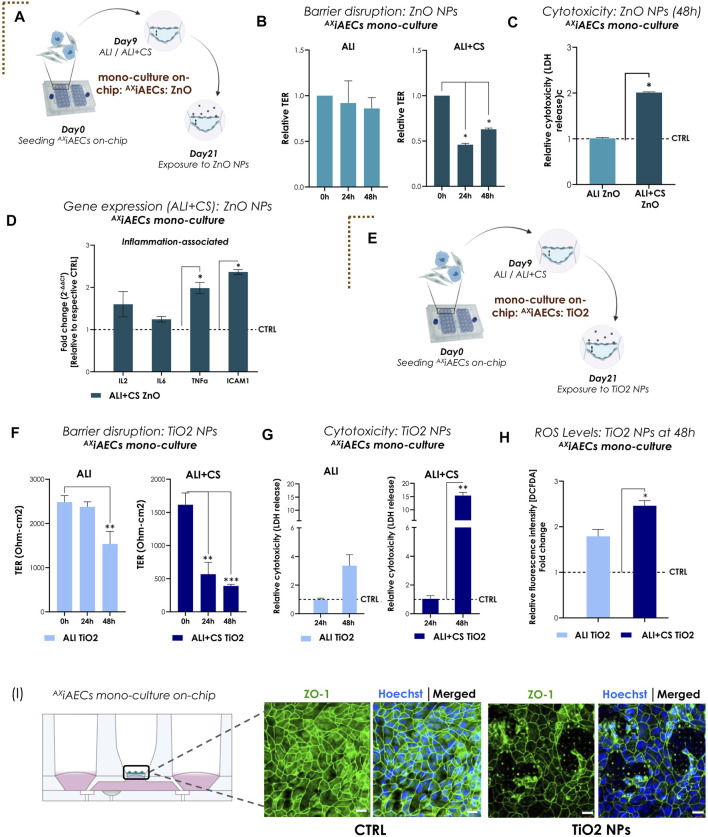
FIGURE 3.
Nanoparticles (NPs)-induced inflammation and barrier disruption in AXiAECs mono-culture on-chip (A) The brown dotted corner bracket suggests the distinction between different trigger-induced models. On day 21 of the mono culture experiment, the AXiAECs were exposed to the ZnO NPs on-chip. Timeline and schematic provide further details of the experiment. (B) TER values (normalized to 0 h timepoint) for ALI and ALI + CS cell cultures exposed to ZnO NPs (n = 3/condition/timepoint). (C) Relative LDH release (NPs exposed with respect to Control; CTRL) shown for 48 h timepoint for ALI and ALI + CS cells (n = 4). (D) mRNA was isolated from CTRL and ZnO exposed cells (ALI + CS) at 48 h exposure timepoint. qPCR studies were performed with n = 4/conditions and exposure significance were measured in relation to CTRL expression levels. (E) Results for AXiAECs mono-cell culture model with TiO2 NPs is denoted by opening another brown dotted corner bracket. Timeline and schematic of TiO2 NPs nebulization on day 21 in monoculture (AXiAECs) on-chip. (F) Absolute TER values (Ohm-cm2) compared pre-TiO2 NPs exposure (at 0 h) with 24h and 48 h after exposure (N = 2; n = 6). (G) Significance for cytotoxicity was calculated relative to respective ALI or ALI+CS CTRL. Cytotoxicity was calculated from LDH release at 24h and 48 h after TiO2 NPs nebulization from both ALI and ALI + CS samples (N = 2; n = 4/time-point). (H) ROS generation was measured using the H2-DCFDA assay (N = 2; n = 4). Fluorescence intensity for exposed cells were normalized with respective healthy CTRL. (I) Representative immunofluorescence staining for alveolar barrier after 48 h of TiO2 NPs exposure. Cells were probed for tight junction, ZO1 (green) and nuclei with Hoechst (blue). Scale bar is 20 µm. Data are shown as mean ± SEM.

