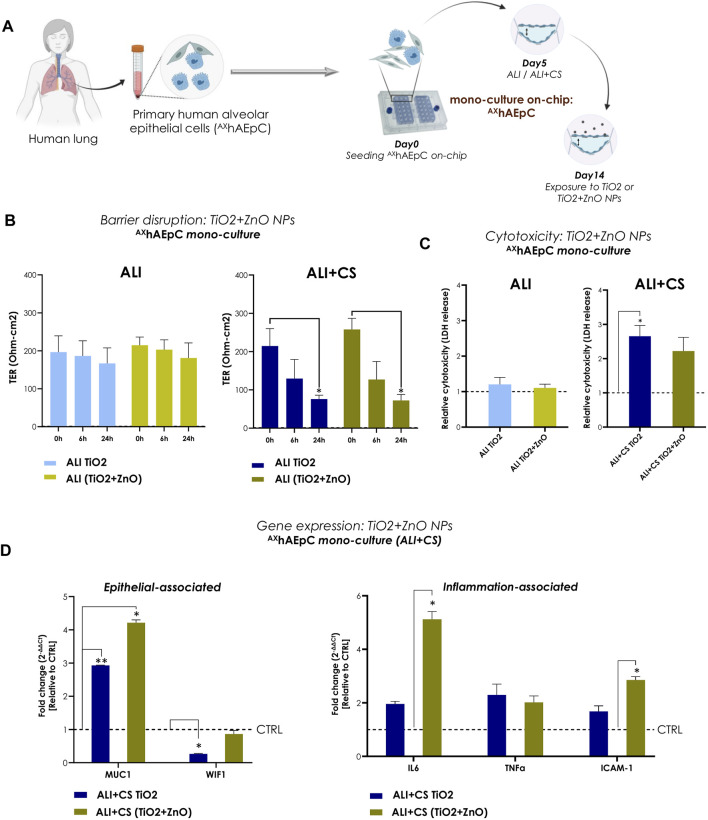
FIGURE 5.
NPs-induced inflammation in primary human alveolar epithelial cells (AXhAEpC) on-chip (A) A schematic representation AXhAEpCs seeded in the AX12 plate. The timeline shows the cell culture and NP exposure process on-chip. (B) TER values (Ohm-cm2) were recorded before NPs nebulization (at 0 h) and at 6h and 24 h after TiO2 and TiO2+ZnO mixed NPs exposure (N = 2; n = 6). The significance of exposure at 6h and 24 h was measured compared with the values at 0 h. (C) The levels of LDH at 24 h were normalized using untreated control samples (ALI and ALI + CS) (N = 2, n = 4). (D) Gene expression was analyzed 24 h after NPs exposure using mRNA harvested from ALI + CS cell cultures. The fold change values were normalized to healthy controls (N = 2, n = 4). Data are shown as mean ± SEM.

