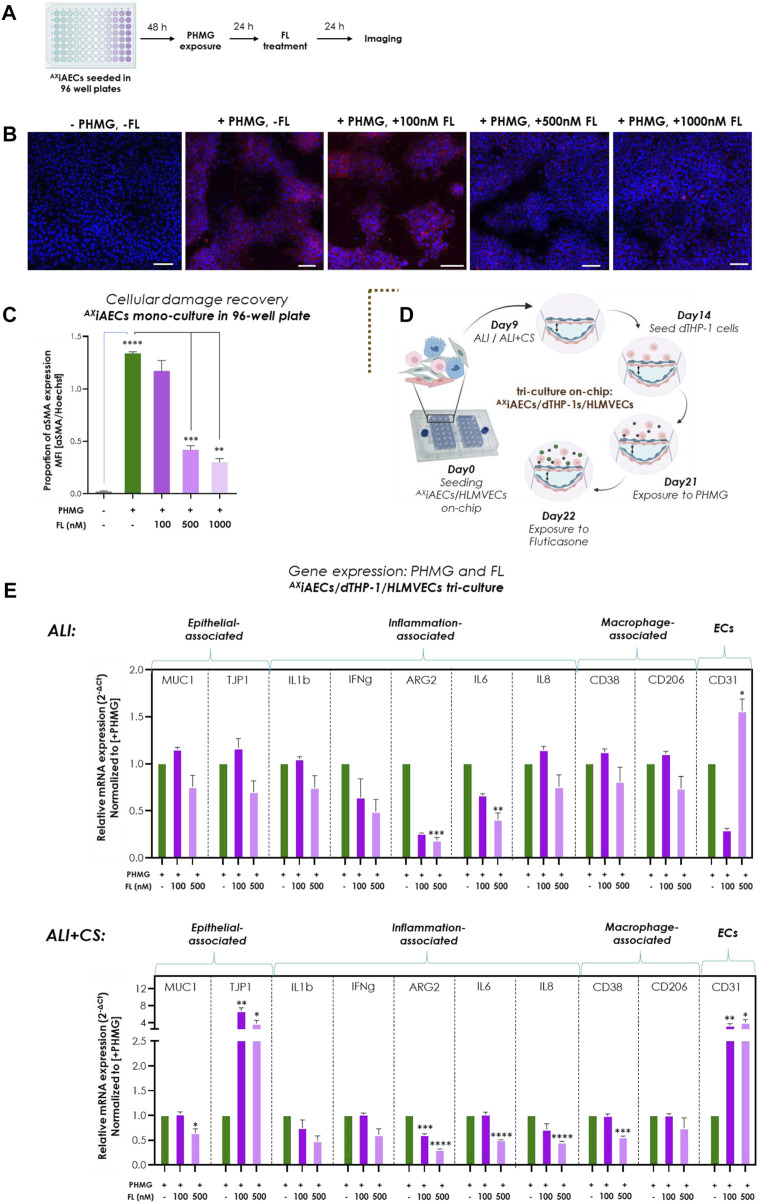
FIGURE 7.
Inhaled Fluticasone reduced PHMG-induced inflammation and EMT (A) Schematic timeline of the PHMG exposure and subsequent FL treatment on AXiAECs mono-culture in 96- well plates. (B) Representative stainings of AXiAECs exposed to PHMG with/without FL treatment under ALI with αMA (in red) and Hoechst (in blue). Scale bar is 100 µm. (C) The mean fluorescent intensity (MFI) was calculated and the proprotion of αSMA expression was calculated by normalizing with the nuclei intensity. PHMG exposed cells (+PHMG, -FL) was compared with healthy untreated controls (-PHMG, -FL) to check inflammation by PHMG. Next, PHMG exposed cells (+PHMG, -FL) were compared with PHMG and FL treated cells (+PHMG, +100nM/500nM/1000 nM FL) to check anti-inflammatory effect of FL. Region of interest (ROI or n = 6/conditions). Data are shown as mean ± SEM. (D) Brown dotted brackets represent on-chip experiments. Timeline and schematic for PHMG and FL treatment in tri-cell culture (AXiAECs/d-THP1s/HLMVECs) on-chip. (E) Selected genes for epithelial cells, inflammation-associated, macrophage and endothelial cells were measured under both ALI and ALI + CS conditions on-chip. Significance associated with FL treated cells were estimated by comparing inflamed cells (+PHMG, -FL) with 100 nM (+PHMG, +100 nM FL) and 500 nM (+PHMG, +500 nM FL) FL nebulized cells (N = 2, n = 8). Data are shown as mean ± SEM normalized to PHMG induced but without subsequent FL (+PHMG -FL) treatment.

