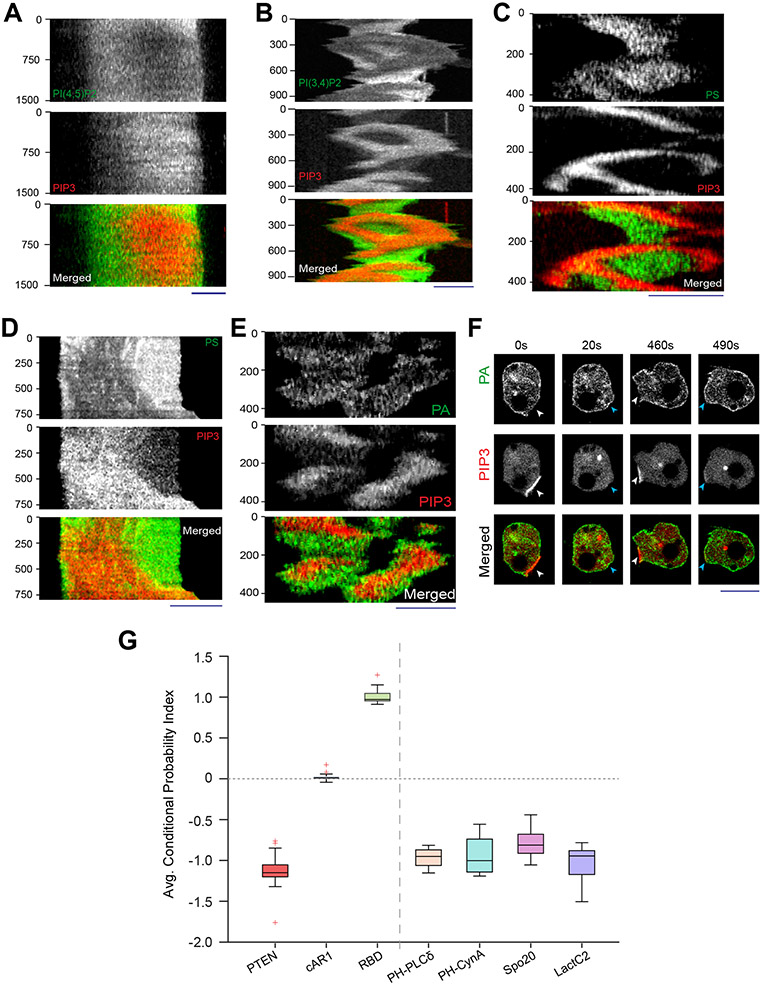
Extended Data Figure 3: PI(4,5)P2, PI(3,4)P2, PS, and PA exhibit consistent yet dynamic back-state distribution.
(A) Representative line-kymograph of ventral waves in RAW 264.7 macrophages co-expressing PI(4,5)P2 biosensor (GFP-PHPLCδ), and PIP3 biosensor (PHAkt-mCherry). Time-lapse images and line-scan intensity profiles were shown in Figure 1C. (B) Representative line-kymograph of ventral waves in Dictyostelium cells co-expressing PI(3,4)P2 biosensor (PHCynA-KikGR) and PIP3 biosensor (PHCrac-mCherry). Time-lapse images and line-scan intensity profiles were shown in Fig. 1D. (C) Representative line-kymographs of ventral wave pattern shown in Dictyostelium cells co-expressing PS biosensor (GFP-LactC2) and PIP3 biosensor, (PHCrac-mCherry). Time-lapse images and line-scan intensity profiles were shown in Fig. 1G. (D) Representative line-kymographs of ventral wave pattern in RAW 264.7 macrophage cells co-expressing PS biosensor (GFP-LactC2) and PIP3 biosensor, (PHCrac-mCherry). Time-lapse images and line-scan intensity profiles were shown in Figure 1H. (E) Representative line-kymographs of ventral wave pattern in Dictyostelium cells co-expressing PA biosensor (GFP-Spo20) and PIP3 biosensor (PHCrac-mCherry). Time-lapse images and line-scan intensity profiles were shown in Fig. 1J. (F) Time-lapse images of migrating Dictyostelium cells co-expressing GFP-Spo20 and PHcrac-mCherry. White arrows: Protrusions where PIP3 is enriched and PA is depleted. Blue arrows: Spo20 returned back to the membrane as protrusions were eventually retracted and membrane domain returned to its basal back-state. (G) Box and Whisker plot of time-averaged CP indices of four anionic phospholipids (PI(4,5)P2, PI(3,4)P2, PS, and PA), together with uniform membrane marker control cAR1, back protein PTEN, and front sensor RBD; nc=16 cells for PI(4,5)P2/PHPLCδ, nc=10 cells for PI(3,4)P2/PHCynA, nc=15 cells for PS/LactC2, nc=16 cells for PS/Spo20, nc =20 cells for cAR1, nc = 17 cells for PTEN, nc = 15 cells for RBD. As mentioned earlier, to generate each datapoint, nf =20 frames were averaged for the above-mentioned number of cells.

