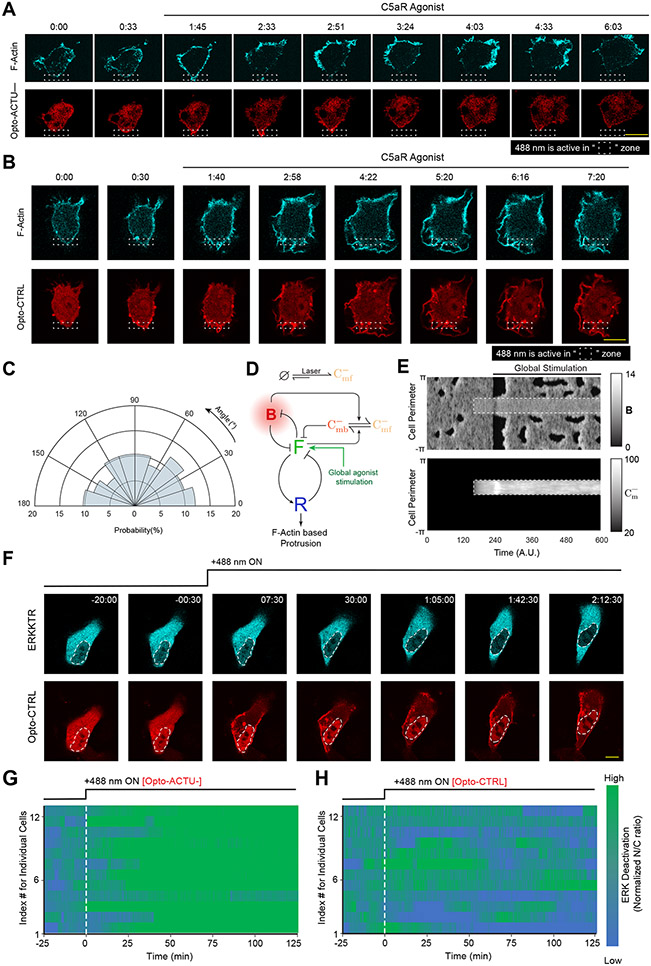
Extended Data Figure 10: Selective recruitment of uncharged control Opto-CTRL cannot suppress protrusion in RAW 264.7 macrophages or global recruitment of Opto-CTRL cannot deactivate ERK in MCF10A cells, unlike Opto-ACTU−.
(A) Representative live-cell time-lapse images of RAW 264.7 cells undergoing light-triggered spatially confined recruitment of Opto-ACTU−, followed by global stimulation with C5a receptor agonist, demonstrating selective protrusion suppression in the site where Opto-ACTU− was locally recruited and robust protrusion formation in other areas of cortex. Time in min:sec format. Cells were co-expressing Opto-ACTU−, CIBN-CAAX, and Lifeact-mVenus. (B) Representative live-cell time-lapse images of RAW 264.7 cells undergoing light-triggered spatially confined recruitment of Opto-CTRL, followed by global stimulation by C5a receptor agonist. Time in min:sec format. Cells were co-expressing Opto-CTRL, CIBN-CAAX, and Lifeact-mVenus. (C) Polar histogram indicating probability of protrusion formation is essentially uniform over the cortex upon global stimulation with C5a receptor agonist, in spatially confined Opto-CTRL recruited cells; nc=12 cells, np=59 protrusions. (D) Schematic showing coupled system of excitable network, polarity module, and Opto-ACTU− system input along with global agonist stimulation. (E) The simulated kymographs of B (top) and (bottom) in response to local recruitment of Opto-ACTU−. The location of recruitment is denoted by the white dashed box. The solid black line denotes the span of global agonist stimulation. (F) Representative live-cell time-lapse images of a MCF10A cell displaying ERKKTR maintaining its cytosolic distribution upon Opto-CTRL recruitment, demonstrating no substantial ERK deactivation; cells were pre-treated with and maintained in a saturated dose of EGF throughout the experiment. Time in hr:min:sec format; 488 nm laser was first turned ON at t=0 min. (G, H) Individual cell level changes in the nuclear/cytosolic ratio of ERKKTR over time, upon recruitment of Opto-ACTU− (G) or Opto-CTRL (H). Population average is in Figure 8I. The color scale shown in right is applicable to both panels.

