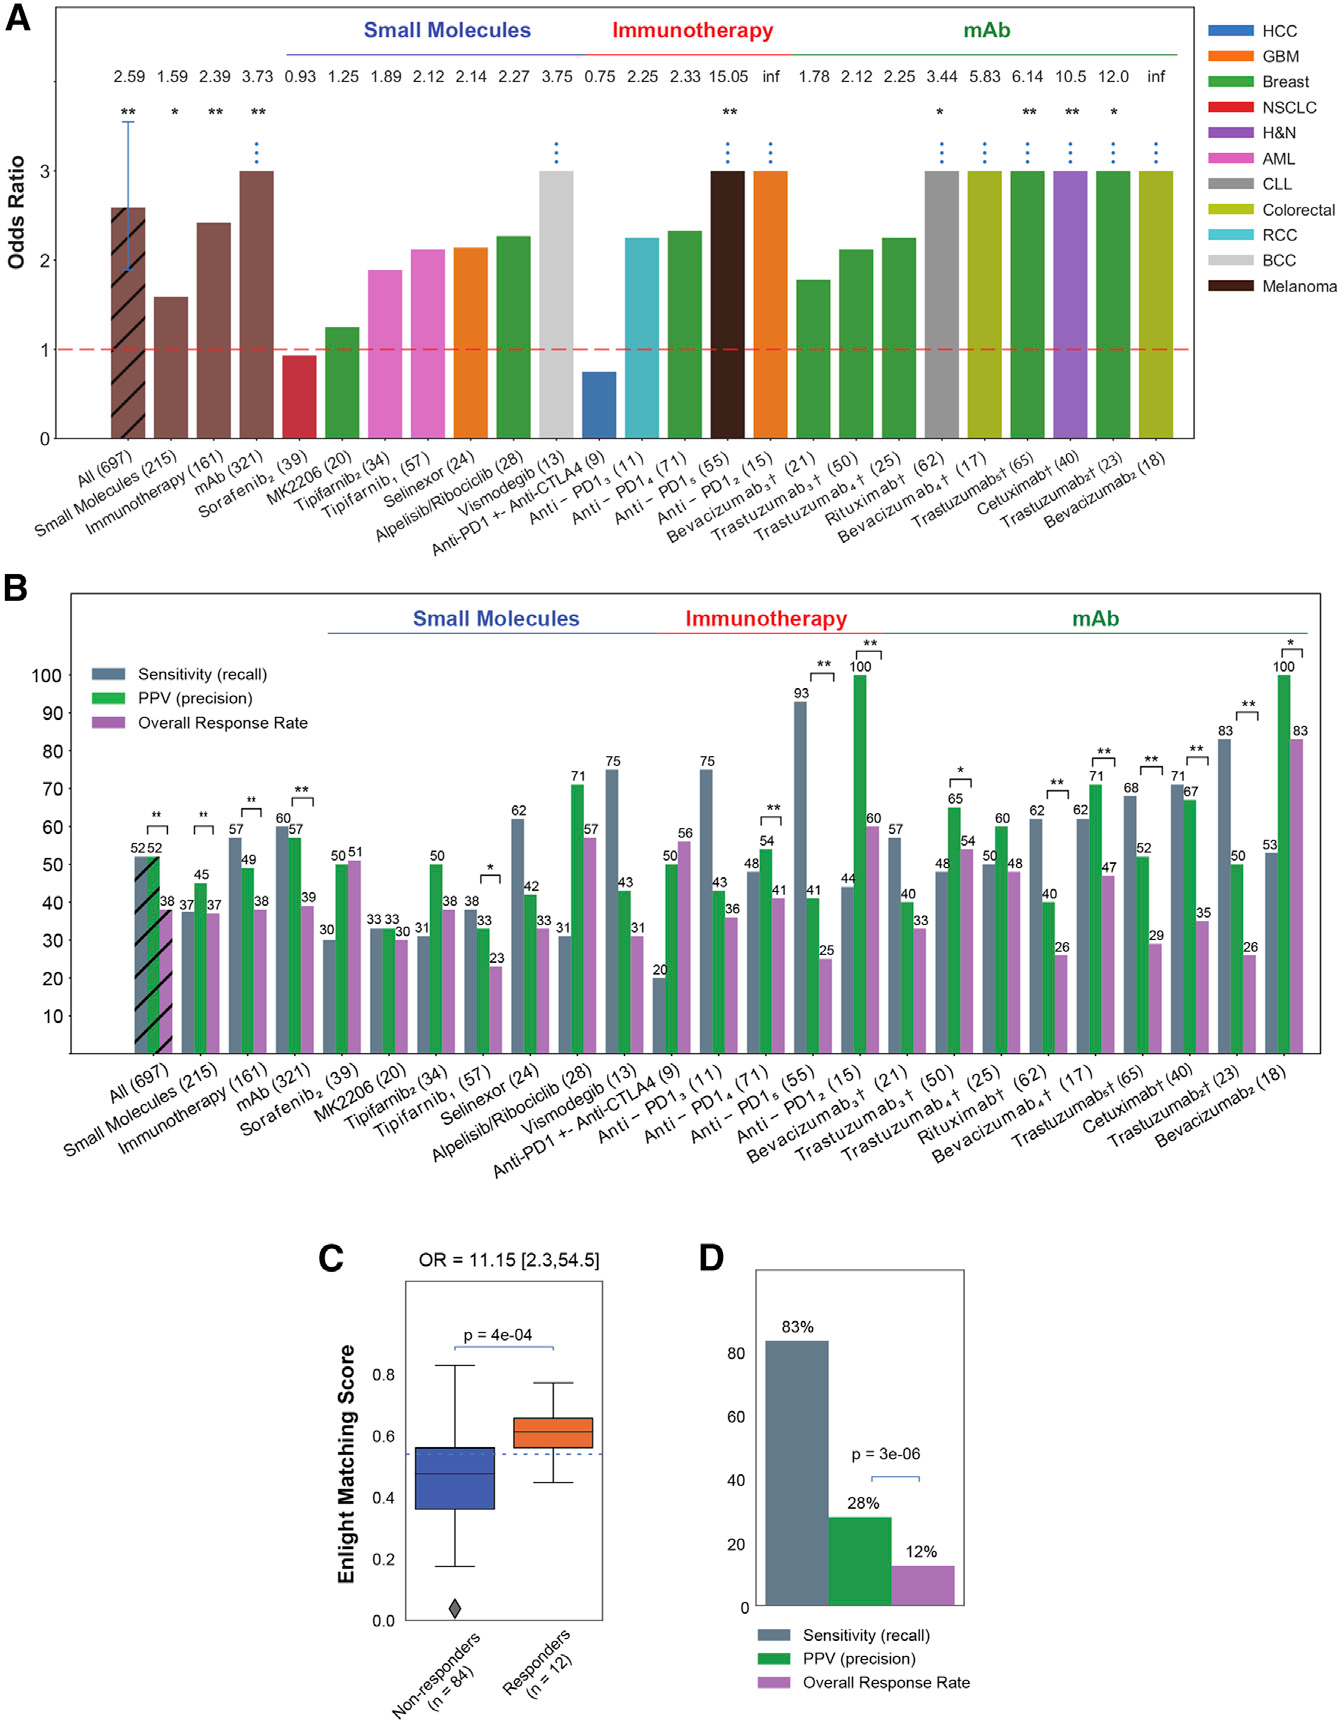
Figure 2. ENLIGHT’s ability to stratify patients for therapy.

(A) The bar graphs show the OR for response of ENLIGHT-matched cases in the 21 evaluation cohorts (OR values appear on top of each bar; all eight patients predicted to respond in the bevacizumab2 cohort responded to the treatment, resulting in an infinite OR), along with the OR for the aggregation of all cohorts and aggregation based on therapeutic class. Sample sizes are denoted in parentheses. Cohorts for which OR is significantly larger than 1 according to Fisher’s exact test are denoted with asterisks. “Anti-PD1” encompasses three different drugs (nivolumab, pembrolizumab, and durvalumab) (see details in Table S1). Vertical error bars in the “All” bar denotes 95% confidence interval for the OR.
(B) Analogous to (A) but presenting the sensitivity and PPV of ENLIGHT-matched cases versus the overall response rate for the evaluation cohorts and their aggregations. Significant differences between PPV and response rate according to the one-sided proportion test are denoted with asterisks.
(C) In the WINTHER trial, responders (orange) have significantly higher EMS than non-responders (blue); the p value was calculated using a one-sided Mann-Whitney test. 95% confidence interval for the OR is denoted in brackets. The horizontal line marks the decision threshold (0.54).
(D) The sensitivity and PPV of ENLIGHT-matched cases versus overall response rate in the WINTHER trial. p value was calculated according to the one-sided proportion test. †Patients in these cohorts received a combination of targeted and chemotherapy; *p < 0.1, **p < 0.05.
