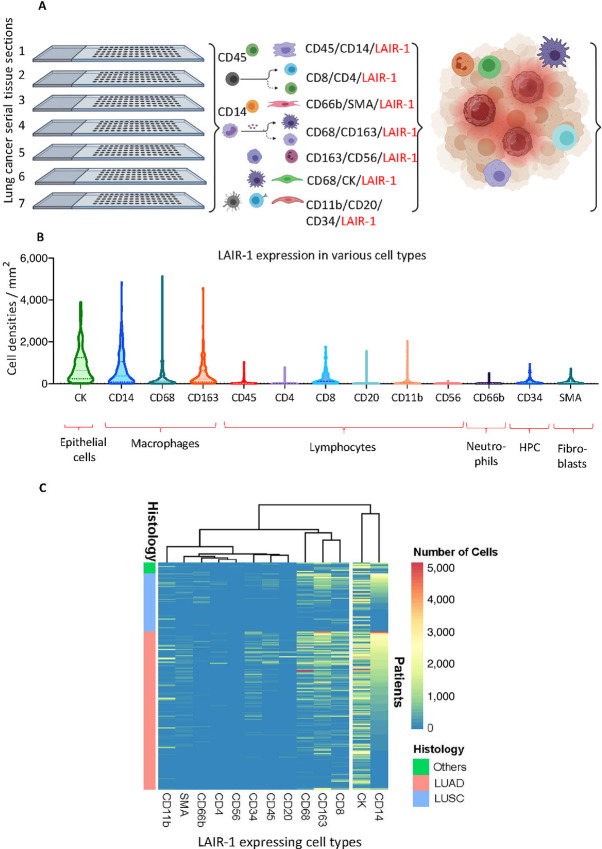
FIGURE 4.
Quantification of LAIR-1–expressing cell densities/mm2 within both stroma and tumor. A, Schematic diagram demonstrating the identification of various cell types expressing LAIR-1 on mQIF from Lung TMA serial sections (created with BioRender.com). B, Quantification of LAIR-1–expressing cell densities/mm2 in Lung TMA serial tissue sections. C, Heatmap illustrating the abundance of LAIR-1–expressing cell types in different histologic subtypes of NSCLC.

