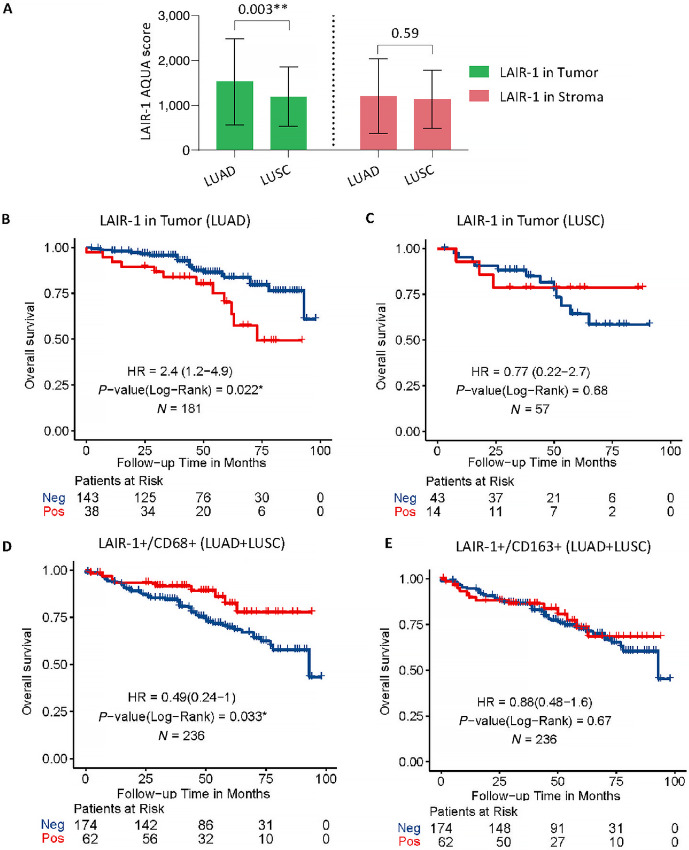
FIGURE 5.
Identification of LAIR-1 expression in different molecular compartments associated with OS in the discovery cohort. A, Bar plot showing the difference in LAIR-1 expression within tumor and stromal compartments of two NSCLC histologic. B, Kaplan–Meier plot identifying the tumor LAIR-1 expression and its association with OS in LUAD subtype. C, Kaplan–Meier plot identifying the tumor LAIR-1 expression and its association with OS in LUSC subtype. D, Kaplan–Meier plot identifying the association of LAIR-1–expressing CD68 cells with OS in the discovery cohort. E, Kaplan–Meier plot showing the association of LAIR-1–expressing CD163 cells with OS in the discovery cohort. Statistical significance was represented as *, P < 0.05 and **, P < 0.01.

