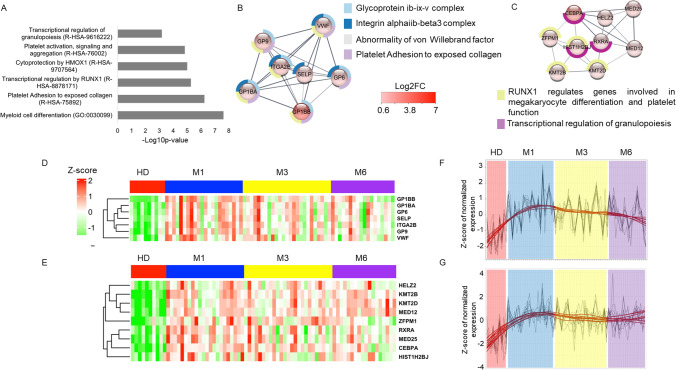
Fig. 4.
Differentially expressed genes shared between the comparisons of convalescent patients at M1, M3, and M6 to HD. A Pathways associated with 477 DEGs shared between convalescent patients at M1, M3, and M6 relative to HD. B, C MCODE 1 and 2 of the 477 DEGs and their main pathways. The spheres are colored depending on the gene fold change (Log2FC), as depicted in the figure. Pathways associated with each MCODE are shown as donuts. D, E Heatmap of gene expression belonging to MCODE 1 and 2. F, G Trend of MCODE 1 and 2 gene expression at M1, M3, M6, and HD

