Appendix D.

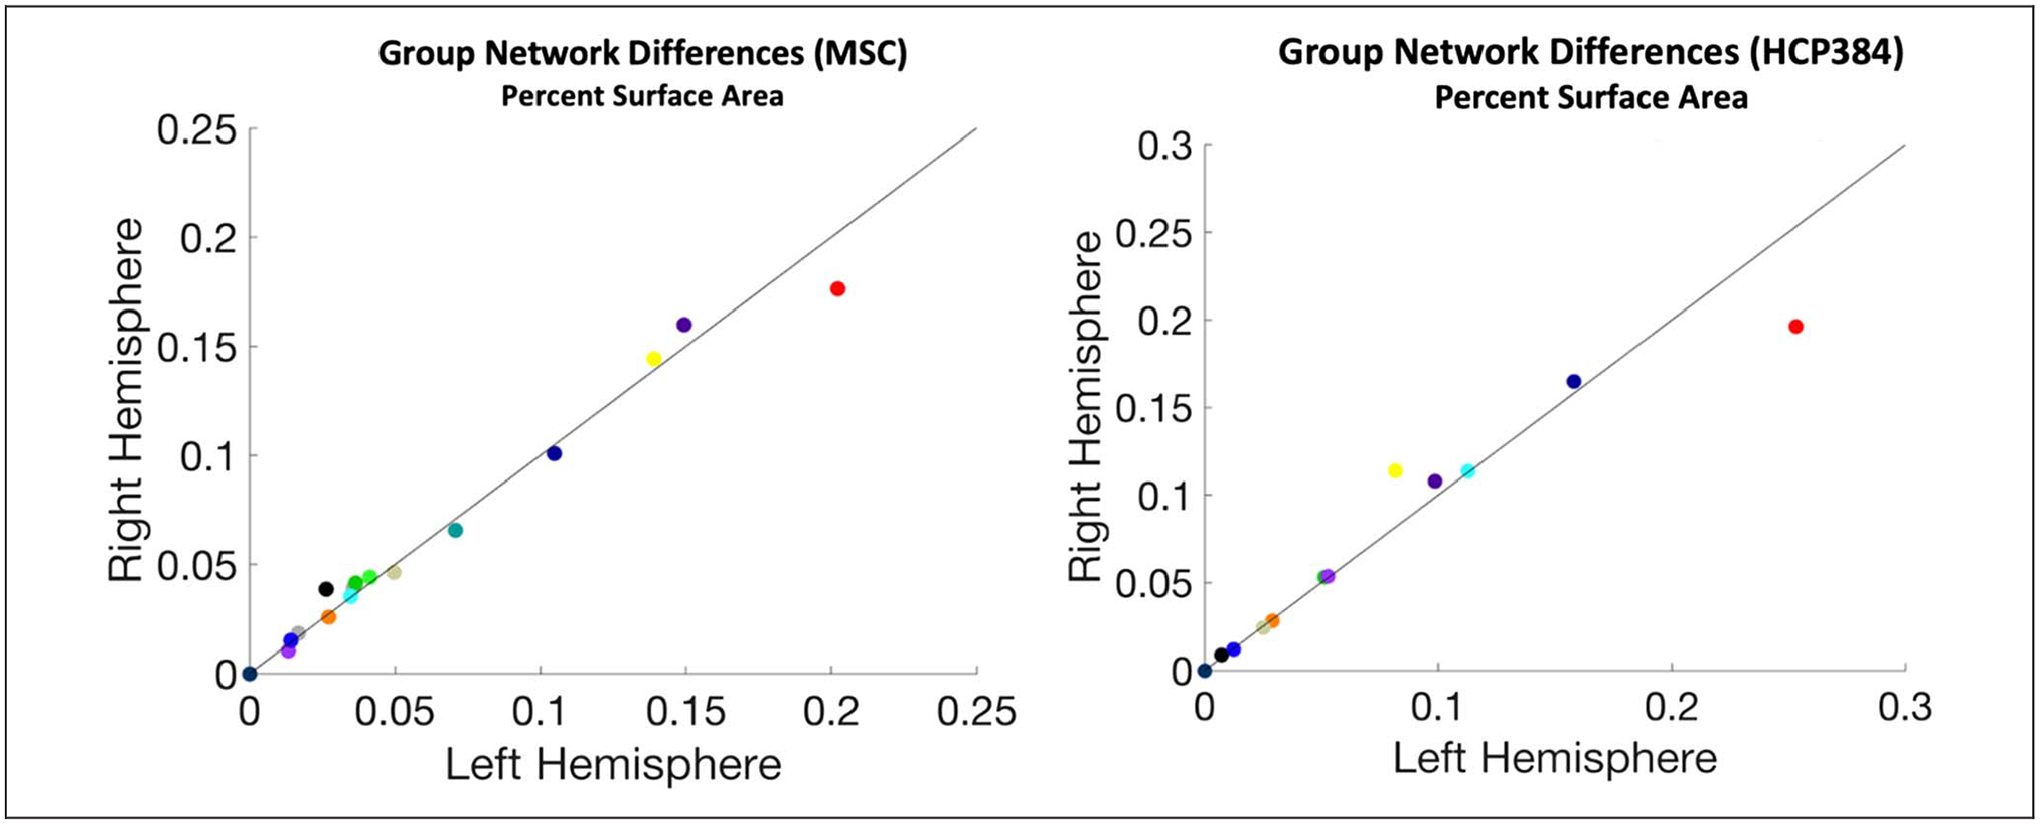
Comparison of surface area across hemispheres of additional group average networks. Two group averages—the MSC and HCP (n = 384)—were examined to observe the consistency of the pattern observed in the Wash U 120 group average (see Figure 4). The DMN consistently exhibits the biggest difference in surface area, with a left-hemisphere lateralization (2.6% in MSC, 5.7% in HCP). Networks were defined using the data-drive network identification procedure InfoMap. Note that the HCP does not include the language, MTL, or T-pole group-level networks because these networks do not emerge consistently across edge density in this data set.
