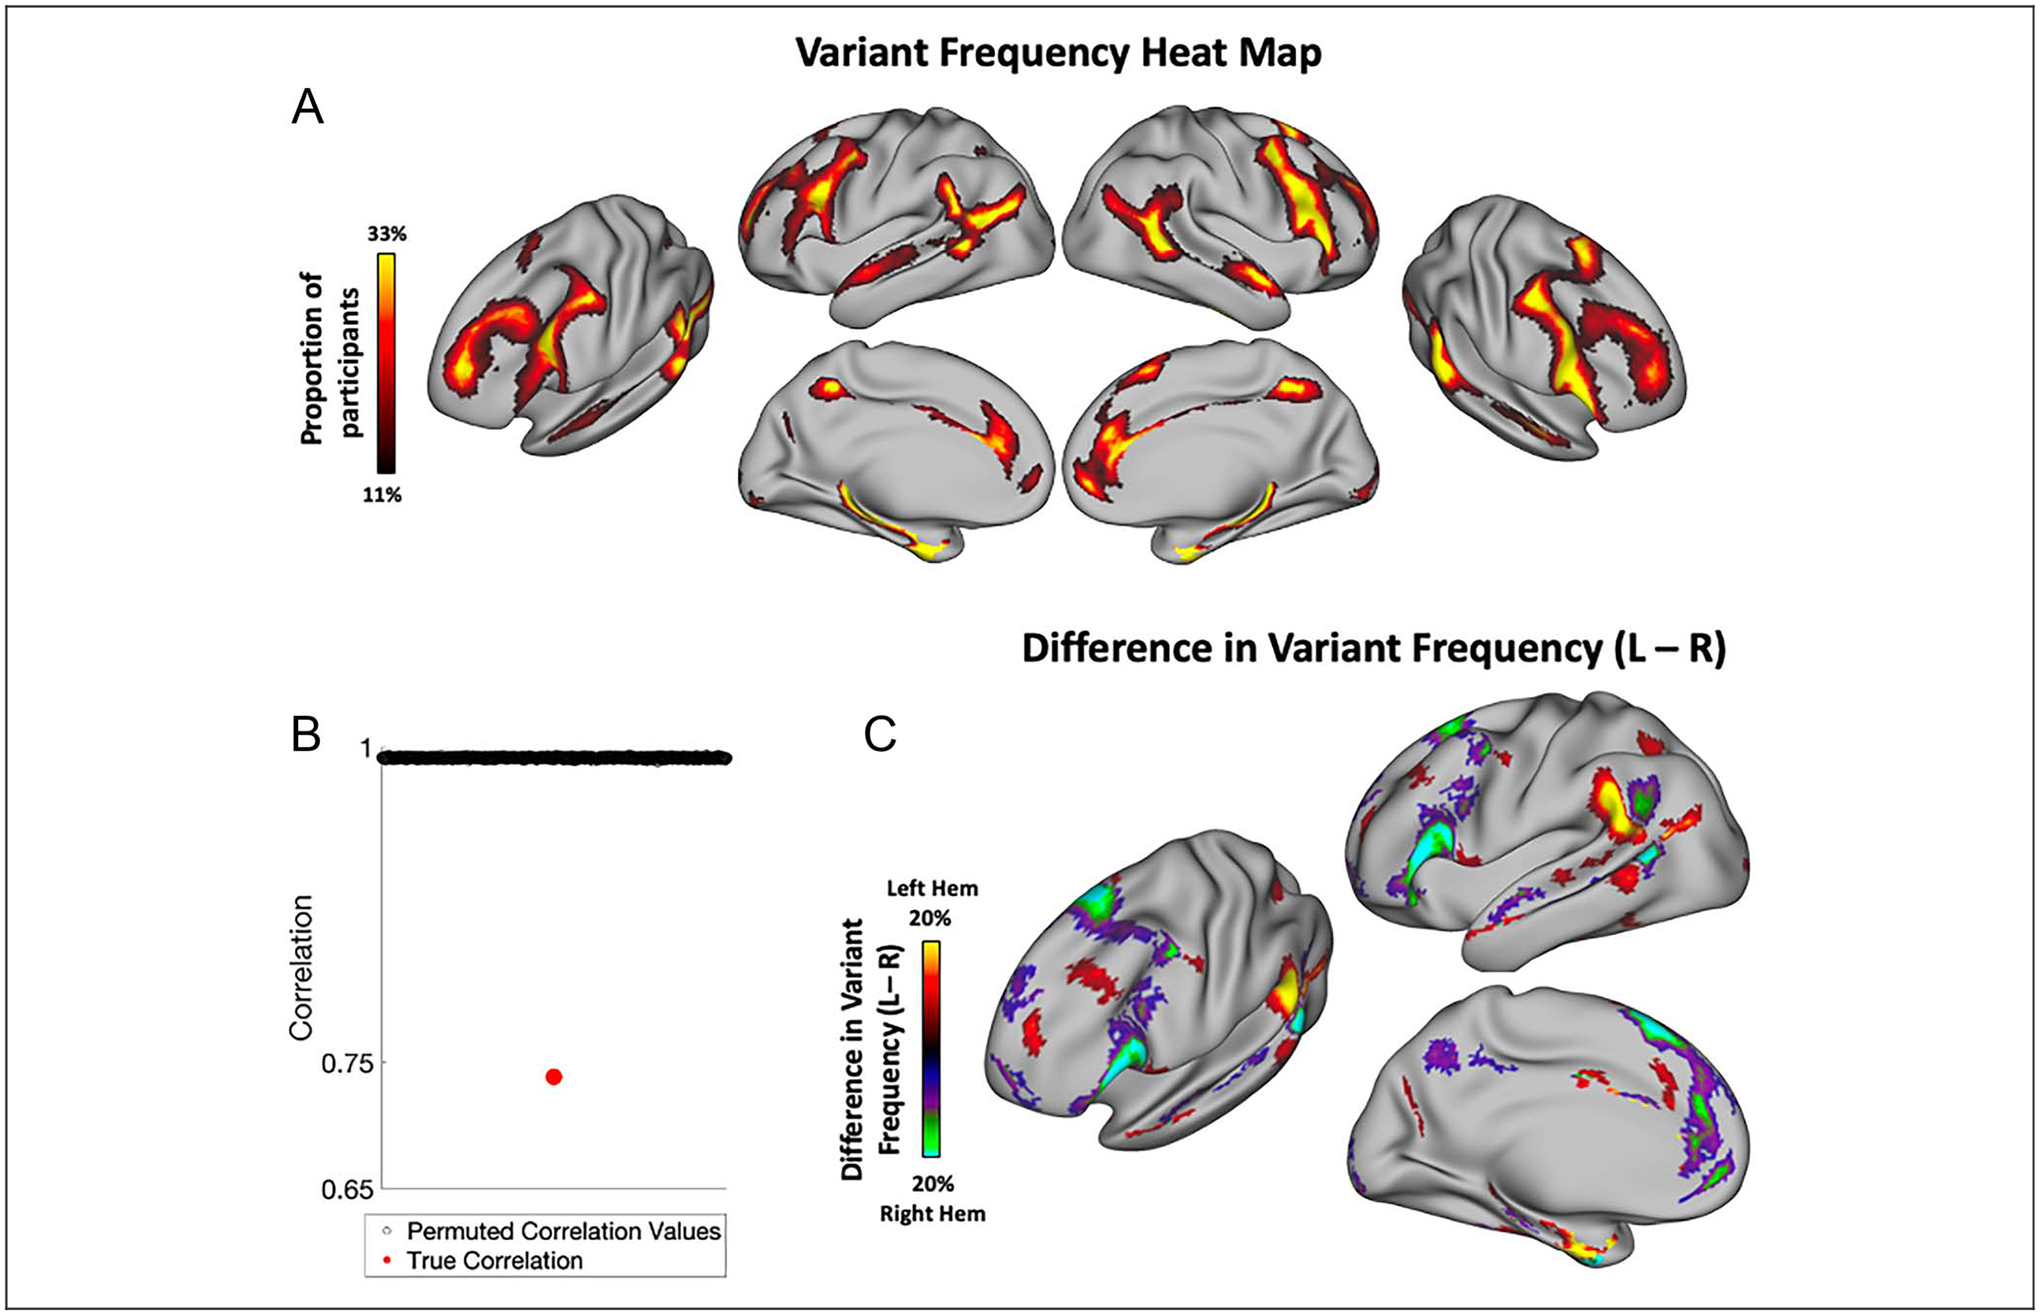
Figure 3.

Hemispheric asymmetries in the spatial distribution of network variants. (A) Frequency of network variants across 384 unrelated participants from the HCP. Network variants have a high frequency in regions of association cortex. (B) Permutation test examining the correlation between variant overlap maps of left and right hemispheres. Permuted correlation values indicate correlations between overlap maps obtained by randomly flipping the left and right hemispheres of participants (see Methods); red dot indicates the true correlation. The two hemispheres have significantly lower similarity than expected by chance. (C) A difference map (projected on the left hemisphere for visualization) shows the regions in which the two hemispheres differ in the proportion of variant frequency, p < .05 cluster-corrected at a frequency difference threshold of 5% (see Appendix C for other thresholds). Warm colors indicate a higher proportion of participants that have a variant at that vertex in left hemisphere, whereas cool colors indicate a higher proportion of participants that have a variant at that vertex in right hemisphere. The spatial distribution of network variants differs significantly across the two hemispheres, with the biggest differences observed in the inferior frontal gyrus, near the temporal parietal junction, and other localized areas of the frontal cortex.
