Appendix A.

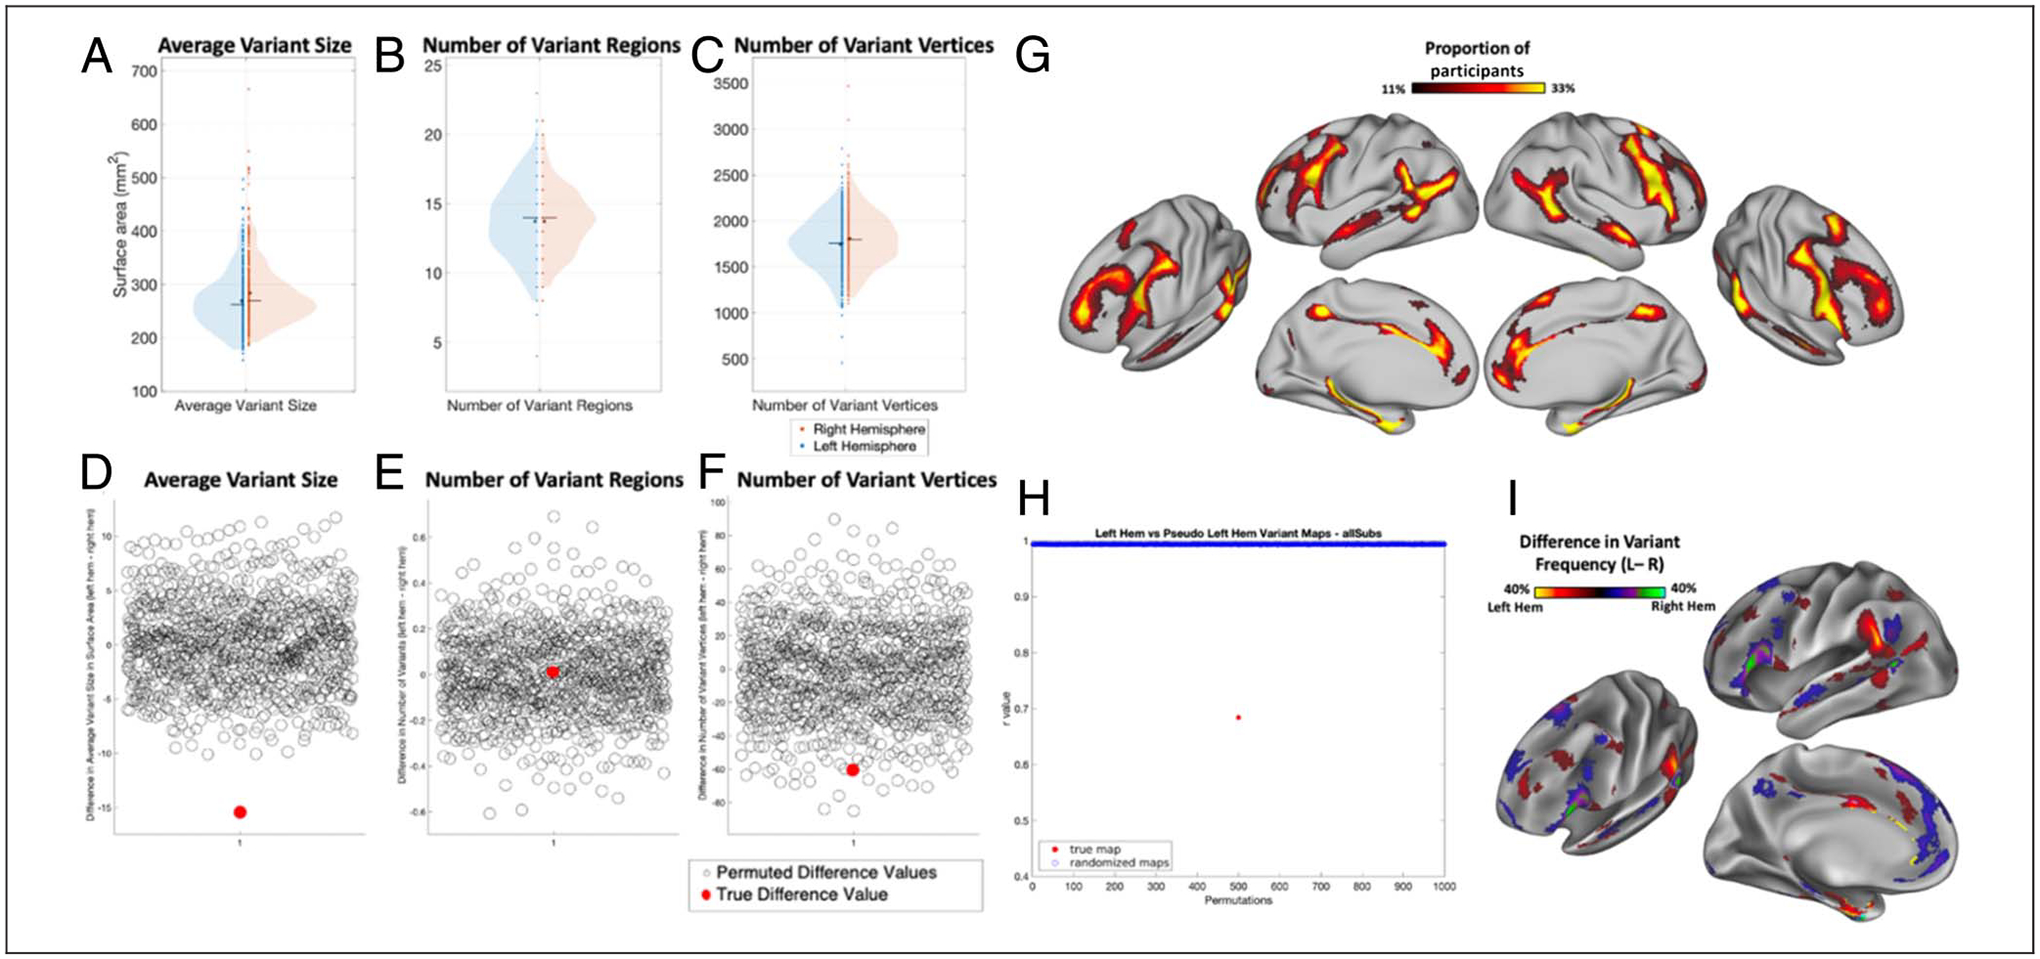
Examination of hemispheric asymmetries in the properties of network variants before undergoing the refinement process (“prevariants”). (A–C) Comparisons of average variant size, number of variant regions, and number of variant vertices across hemispheres in a subsample of 384 participants from the HCP. (D–F) Results of permutation testing for significance. True difference value indicates the difference between the true left and right hemispheres. Permuted difference values indicate differences obtained by randomly flipping the left and right hemispheres of participants 1000 times. (G) Network variant overlap across participants. (H) Results of permutation testing for significance. True map indicates the correlation between variant overlap maps of the true left and right hemispheres. Randomized maps values indicate correlations between overlap maps obtained by randomly flipping the left and right hemispheres of participants 1000 times. (I) A difference map shows the regions in which the two hemispheres differ in the proportion of variant frequency. Warm colors indicate more variant overlap in left hemisphere, whereas cool colors indicate more variant overlap in right hemisphere. The spatial frequency of network variants differs significantly across the two hemispheres. Although this analysis was conducted on network variants that were defined differently than those in the main text, the general distribution and differences across the hemispheres are replicated (compare this figure with Figure 3).
