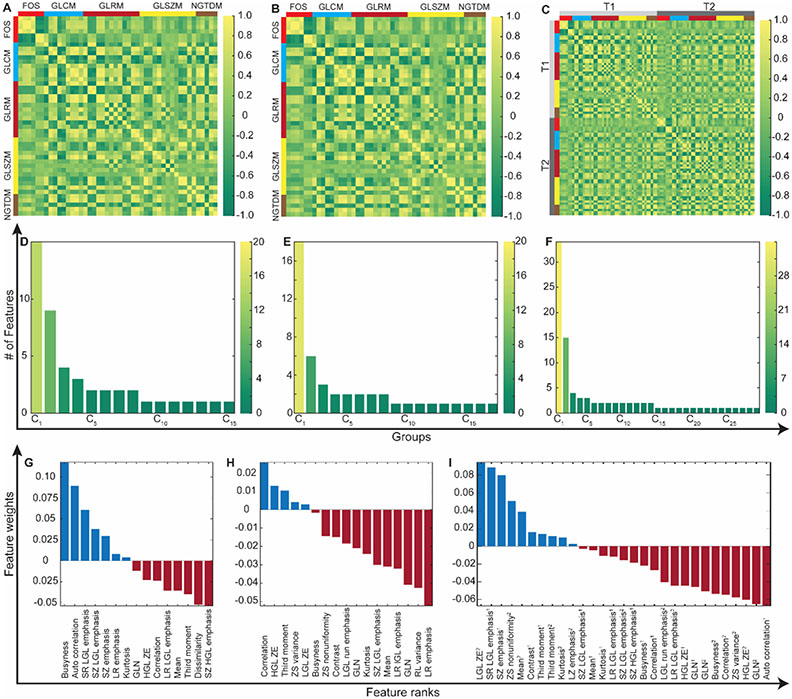
Figure 2.
The framework for selection of the features extracted from T1w and T2w MRI, and their concatenation. (A)-(C) visualizes pairwise correlation coefficients of the computed variables with five different feature extraction methods. (D)-(F) demonstrates the number of features in each cluster generated based on Pearson correlation coefficients. The number of clusters increases with broadening heterogeneity among image features. The importance of the features was determined via RELIEFF algorithm that evaluates the interaction between MRI features and therapeutic measurements (IRE ablation regions and histopathological tumor marker measurements (G-I).
Note: FOS, first-order statistics features; GLCM, gray-level co-occurrence matrix features; GLRM, gray-level run-length matrix features; GLSZM, gray-level size-zone matrix features; and NGTDM, neighborhood gray-tone difference matrix features. T1, T1w MRI; and T2, T2w MRI.

