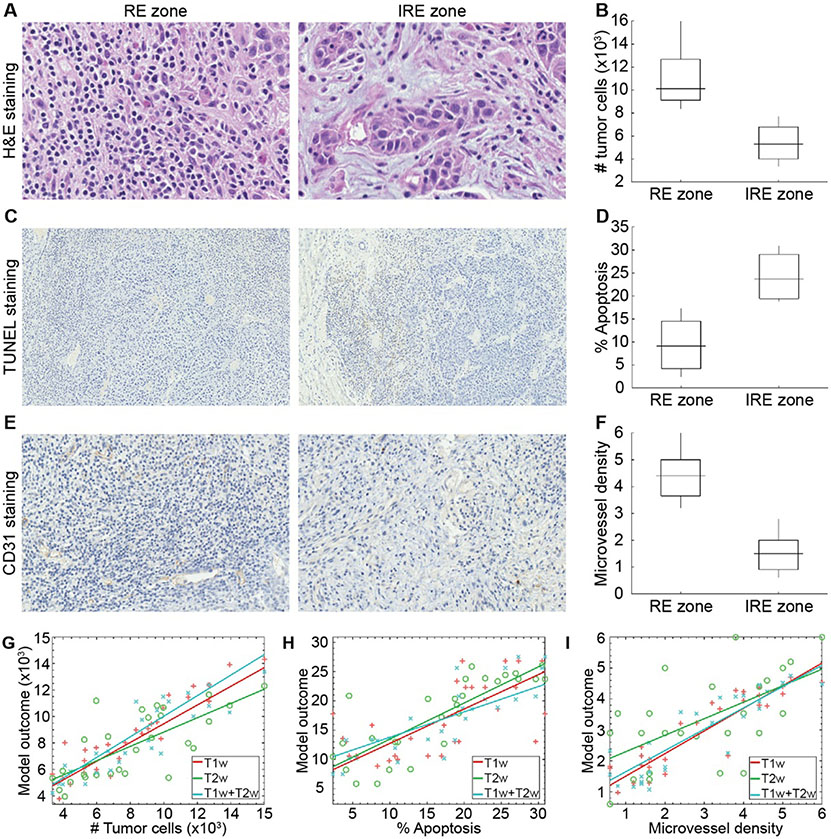
Figure 4.
The representative histological images for visualizing IRE ablation regions (A, C, and D), statistical analysis (B, E, and F), and correlation plots (G-I). A significantly lower number of tumor cells (B), percentage of apoptosis rate (E), and higher microvessel density (F) for IRE zones compared to RE zones. The figures (G)-(I) demonstrate the behavior of the models generated with features of T1w, T2w, and T1w+T2w MRI data.

