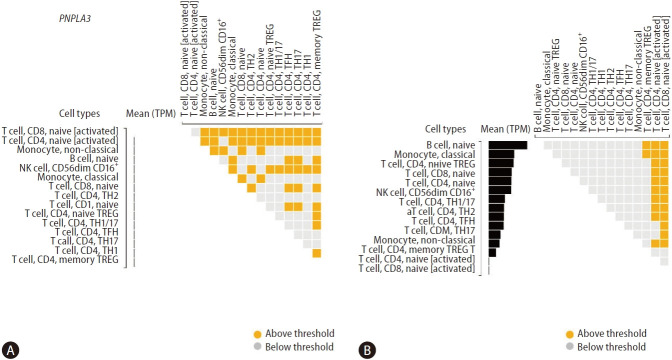
Figure 4.
Gene expression levels of PNPLA3 and HSD17B13 in immune cells. Differential gene expressions of PNPLA3 (A) and HSD17B13 (B) across cell types as calculated by the DESeq package (version 1.6.3). Cells are sorted based on the median gene expression from the highest to the lowest. Squares in the upper diagonal matrix indicate results from pair-wise comparisons of two cell types on the x-axis and y-axis. The figure shows 2 log2 fold-change. Findings were retrieved from the DICE (Database of Immune Cell Expression, Expression quantitative trait loci [eQTLs] and Epigenomics) project (available at https://dice-database.org). PNPLA3, patatin-like phospholipase domain containing 3; HSD17B13, hydroxysteroid 17-beta dehydrogenase 13.

