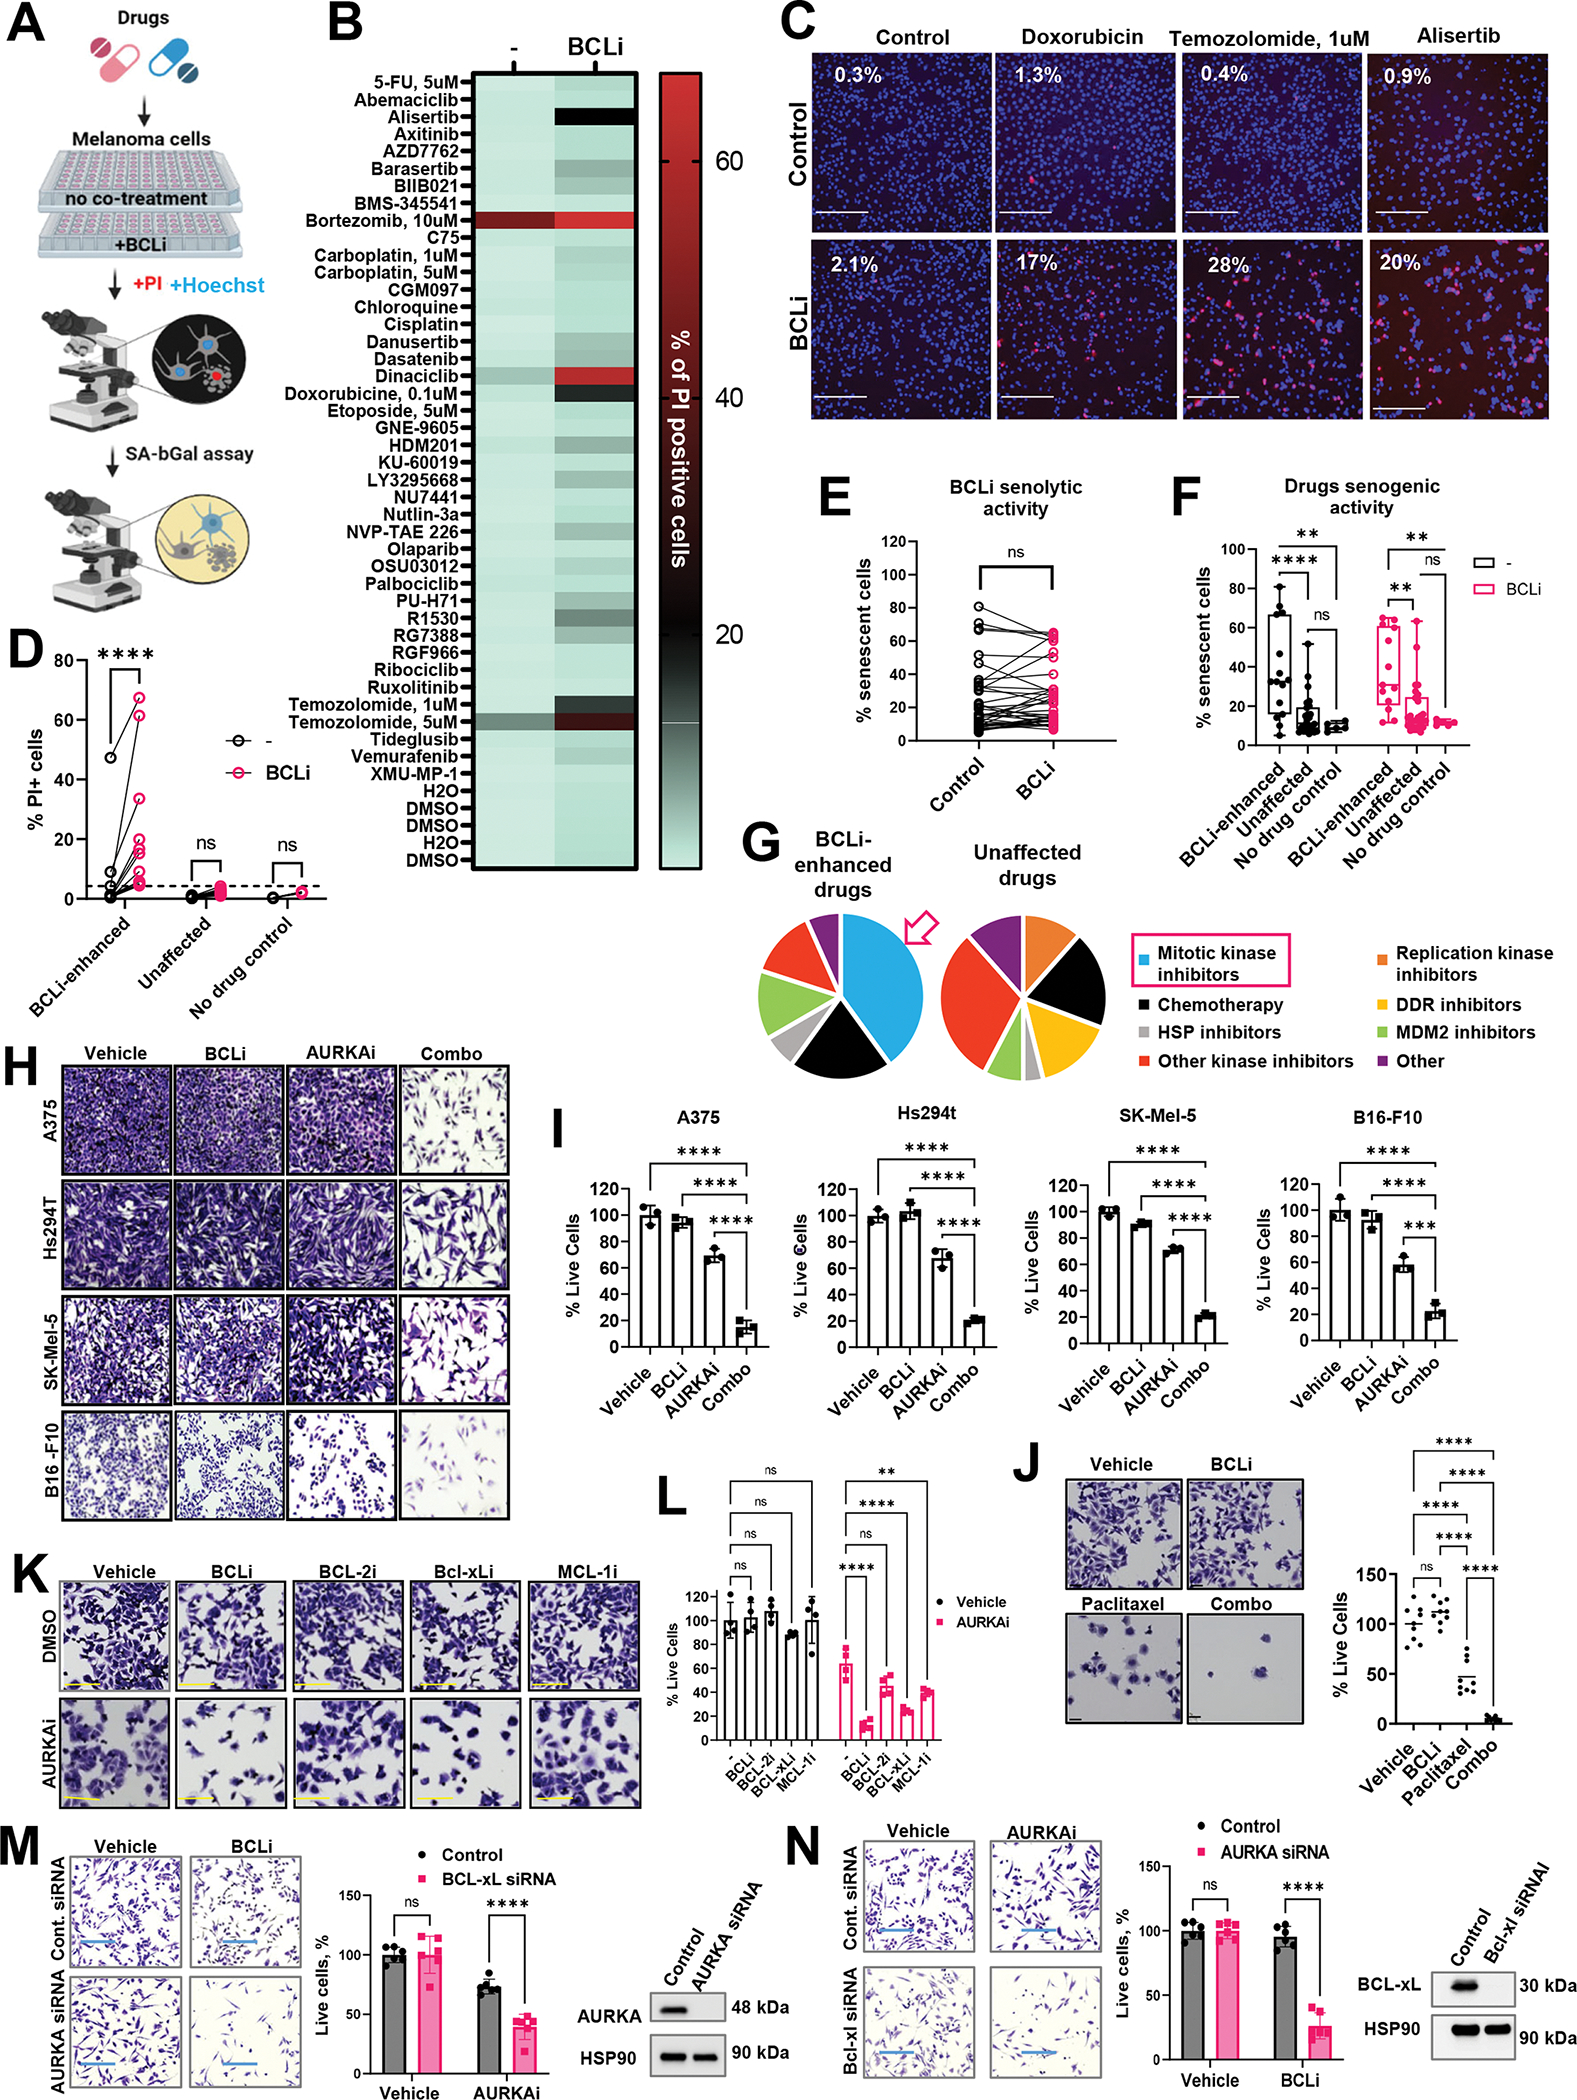
Figure 1. BCL-2/xL inhibition promoted cell death in response to a variety of oncology agents.

(A) Schematic of the drug screen design. (B) Percentages of dead PI-positive cells in cells treated for 24h with indicated drugs in the presence or absence of BCLi navitoclax. Median values from 6 quantified images are shown per each condition. N=6. (C) Representative microscopy images from the library screen shown in B. Numbers in the top left corners indicate the percentages of apoptotic cells. Scale bar 275μm. (D) Identification of drug screen hits. Drugs that, combined with BCLi, induced at least double the percentage of cell death induced by BCLi alone (indicated by the punctate line) were designated as “BCLi-enhanced.”, and all others as “Unaffected.” Statistics using 2-way ANOVA with Sidak’s multiple comparison test. (E) Pairwise comparison of the percentages of senescent cells with and without BCLi addition. Statistical analysis using paired t-test. (F) Comparison of the percentages of senescent cells induced by BCLi-enhanced and unaffected drugs with and without BCLi. Statistics as in D. (G) Drug categories enriched in BCLi-enhanced and unaffected drug groups. (H) Representative images of crystal violet-stained melanoma cells treated with 1μM navitoclax (BCLi), 1μM alisertib (AURKAi), or both drugs combined for 24 h. Scale bar 200 μm. (I) Cell count from the experiment in H. Data is shown as percentages of cells relative to vehicle control. Statistical comparisons using one-way ANOVA with Dunnett’s post-test. N=3. (J) Representative images of crystal violet-stained A375 cells after 24h treatment with vehicle, 1μM navitoclax (BCLi), 1μM paclitaxel, or both drugs combined for 24 h. Scale bar 50μm. Cell quantification relative to vehicle-treated cells is shown on right. Statistical comparisons using one-way ANOVA with Tukey’s test. N=9 random fields from 3 individual wells (3 images/well). (K) Representative images of crystal violet-stained A375 cells after 24h treatment with 1μM navitoclax (BCL-2/xLi), 1μM venetoclax (BCL-2i), 1μM A-1155463 (BCL-xLi), 1μM A-1210477 (MCL-1i) in the presence or absence of 1μM alisertib (AURKAi). Scale bar 150μm. (L) Relative cell numbers from the experiment in K. Data are presented in percentages relative to untreated cells (Vehicle/-) with statistical analysis using 2-way ANOVA with Sidak’s post-test. Experiment was repeated three times with consistent results. (M) Left: representative images of crystal violet-stained Hs294T cells transfected with AURKA or non-targeting siRNA and treated with 1μM navitoclax (BCL-2/xLi) for 24h. Scale bar 275μm. Experiment was performed with three biological replicates. Middle: quantification from 6 random fields per condition and one-way ANOVA statistical analysis with Sidak’s post-test. Right: efficiency of target knockdown determined by western. (N) Same as M, except BCL-xL-targeting siRNA was used and cells were treated with 1μM alisertib (AURKAi) for 24h. All panels: Ns P > 0.05, * P≤ 0.05, ** P ≤ 0.01, *** P ≤ 0.001, **** P ≤ 0.0001. When applicable, p-values were adjusted for multiple comparisons. See also Fig. S1.
