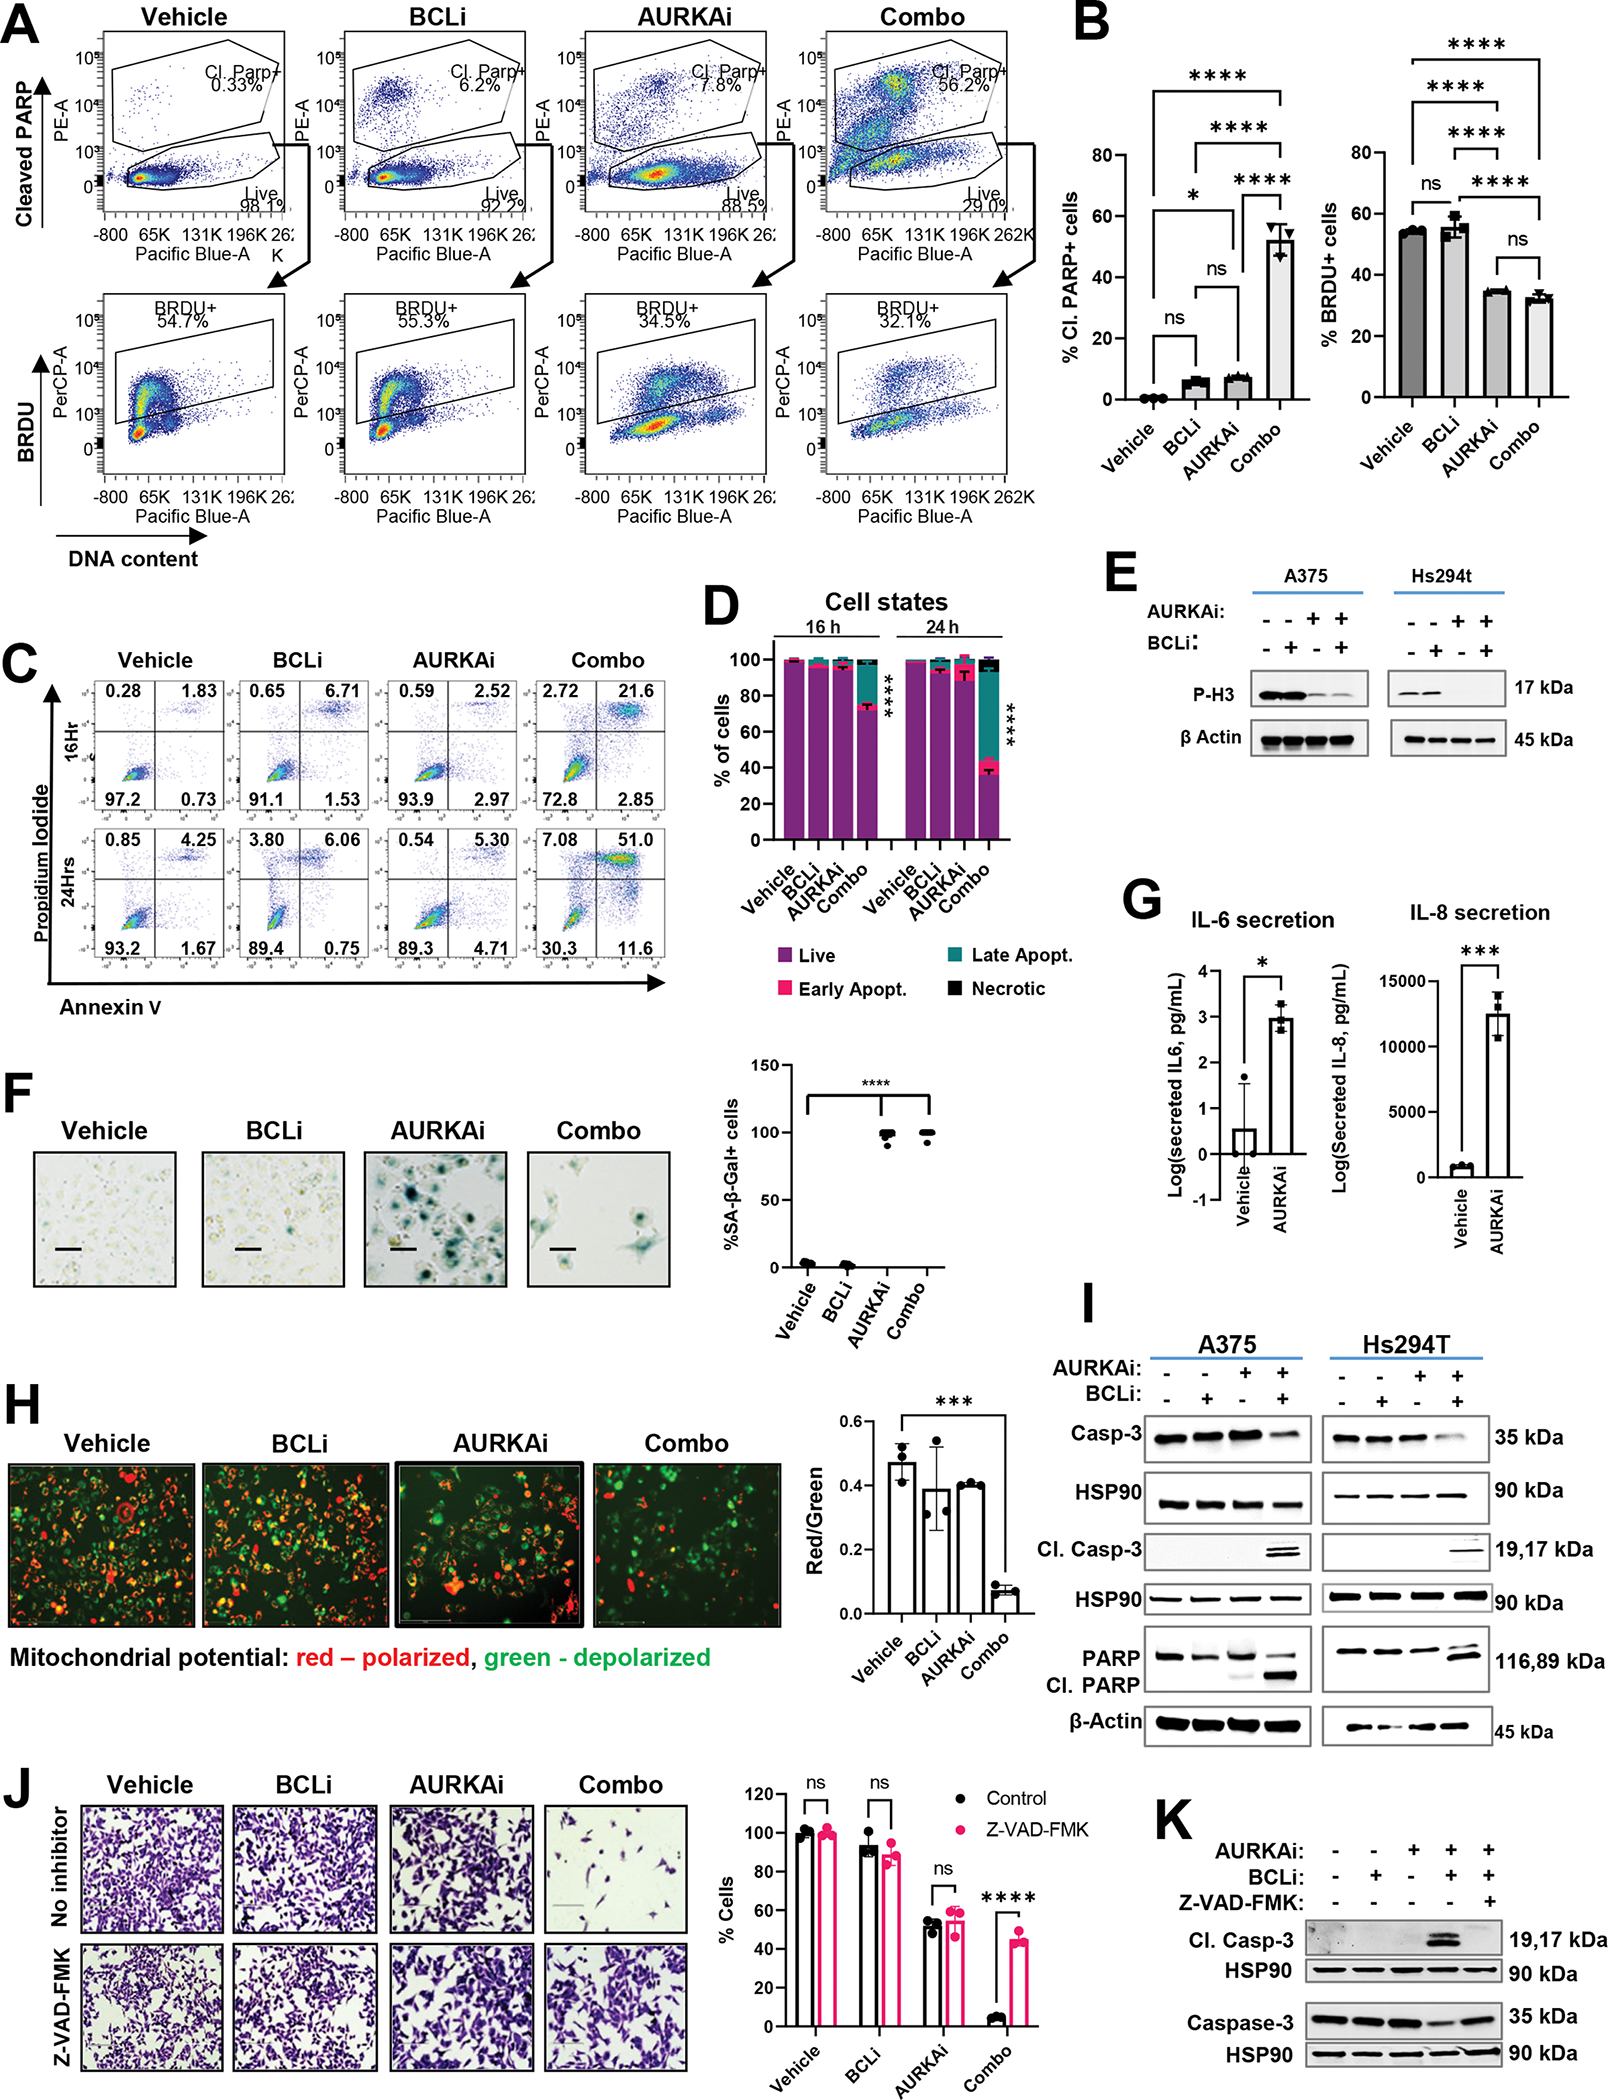
Figure 2. Treatment combining AURKAi and BCLi induced apoptosis associated with mitochondrial depolarization and caspase activation.

(A) Representative flow cytometry plots from PARP cleavage and BrdU incorporation assay. A375 cells were treated with vehicle, 1μM navitoclax (BCLi), 1μM alisertib (AURKAi) or both drugs combined for 24 hours and pulsed with BrdU for 5 hours. BRDU+ cells were gated on live cells (cells with cleaved PARP and with sub-G1 DNA content were gated out). (B) Statistical comparison of the percentages of BRDU+ cells and cells with cleaved PARP from A. Statistics by one-way ANOVA with Tukey’s adjustments. N=3. (C) Representative results of Annexin V/PI staining detecting cells in early (bottom right quadrants) and late (top right quadrants) apoptosis. (D) Quantification of experiment in C. Data are presented as mean ± standard deviation for three replicates, 2-way ANOVA with Dunnett’s post-test. (E) Representative results of the senescence-associated (SA) β-galactosidase activity in cells treated as in A for 48 hours. Scale bar 150μm. (F) Quantification of SA-β-Gal positive cells from E, 9 fields from 3 biological replicates. Experiment was repeated two times with consistent results. Statistical analysis using one-way ANOVA with Tukey’s post-test. (G) ELISA of secreted IL-6 and IL-8 in the conditioned media from A375 cells treated with vehicle or 1μM AURKAi alisertib for 24h. (H) Representative results of JC1 staining. JC1 aggregates (red) and monomeric JC1 (green) indicate healthy polarized mitochondria and dysfunctional depolarized mitochondria, respectively. Scale bar 150μm. Quantified data and one-way ANOVA is shown on the right. N=3. (I) Western blot of indicated apoptotic proteins in A375 and Hs294t cells treated as in A for 24 hrs. Three independent experiments were performed with consistent results. (J) Crystal violet staining of A375 cells treated as described in A for 24 hrs in the presence or absence of pan-caspase inhibitor Z-VAD-FMK (20μg/ml). Scale bar 200 μm. Cell count is shown on the right. N=3. Statistics by ANOVA with Tukey/s post-test. (K) Western blot of cleaved and total caspase 3 in A375 cells treated as in K. Two independent experiments were performed. All panels: Ns - P > 0.05, * - P≤ 0.05, ** - P ≤ 0.01, *** - P ≤ 0.001, **** - P ≤ 0.0001. P-values were adjusted for multiple comparisons. See also Fig. S2.
