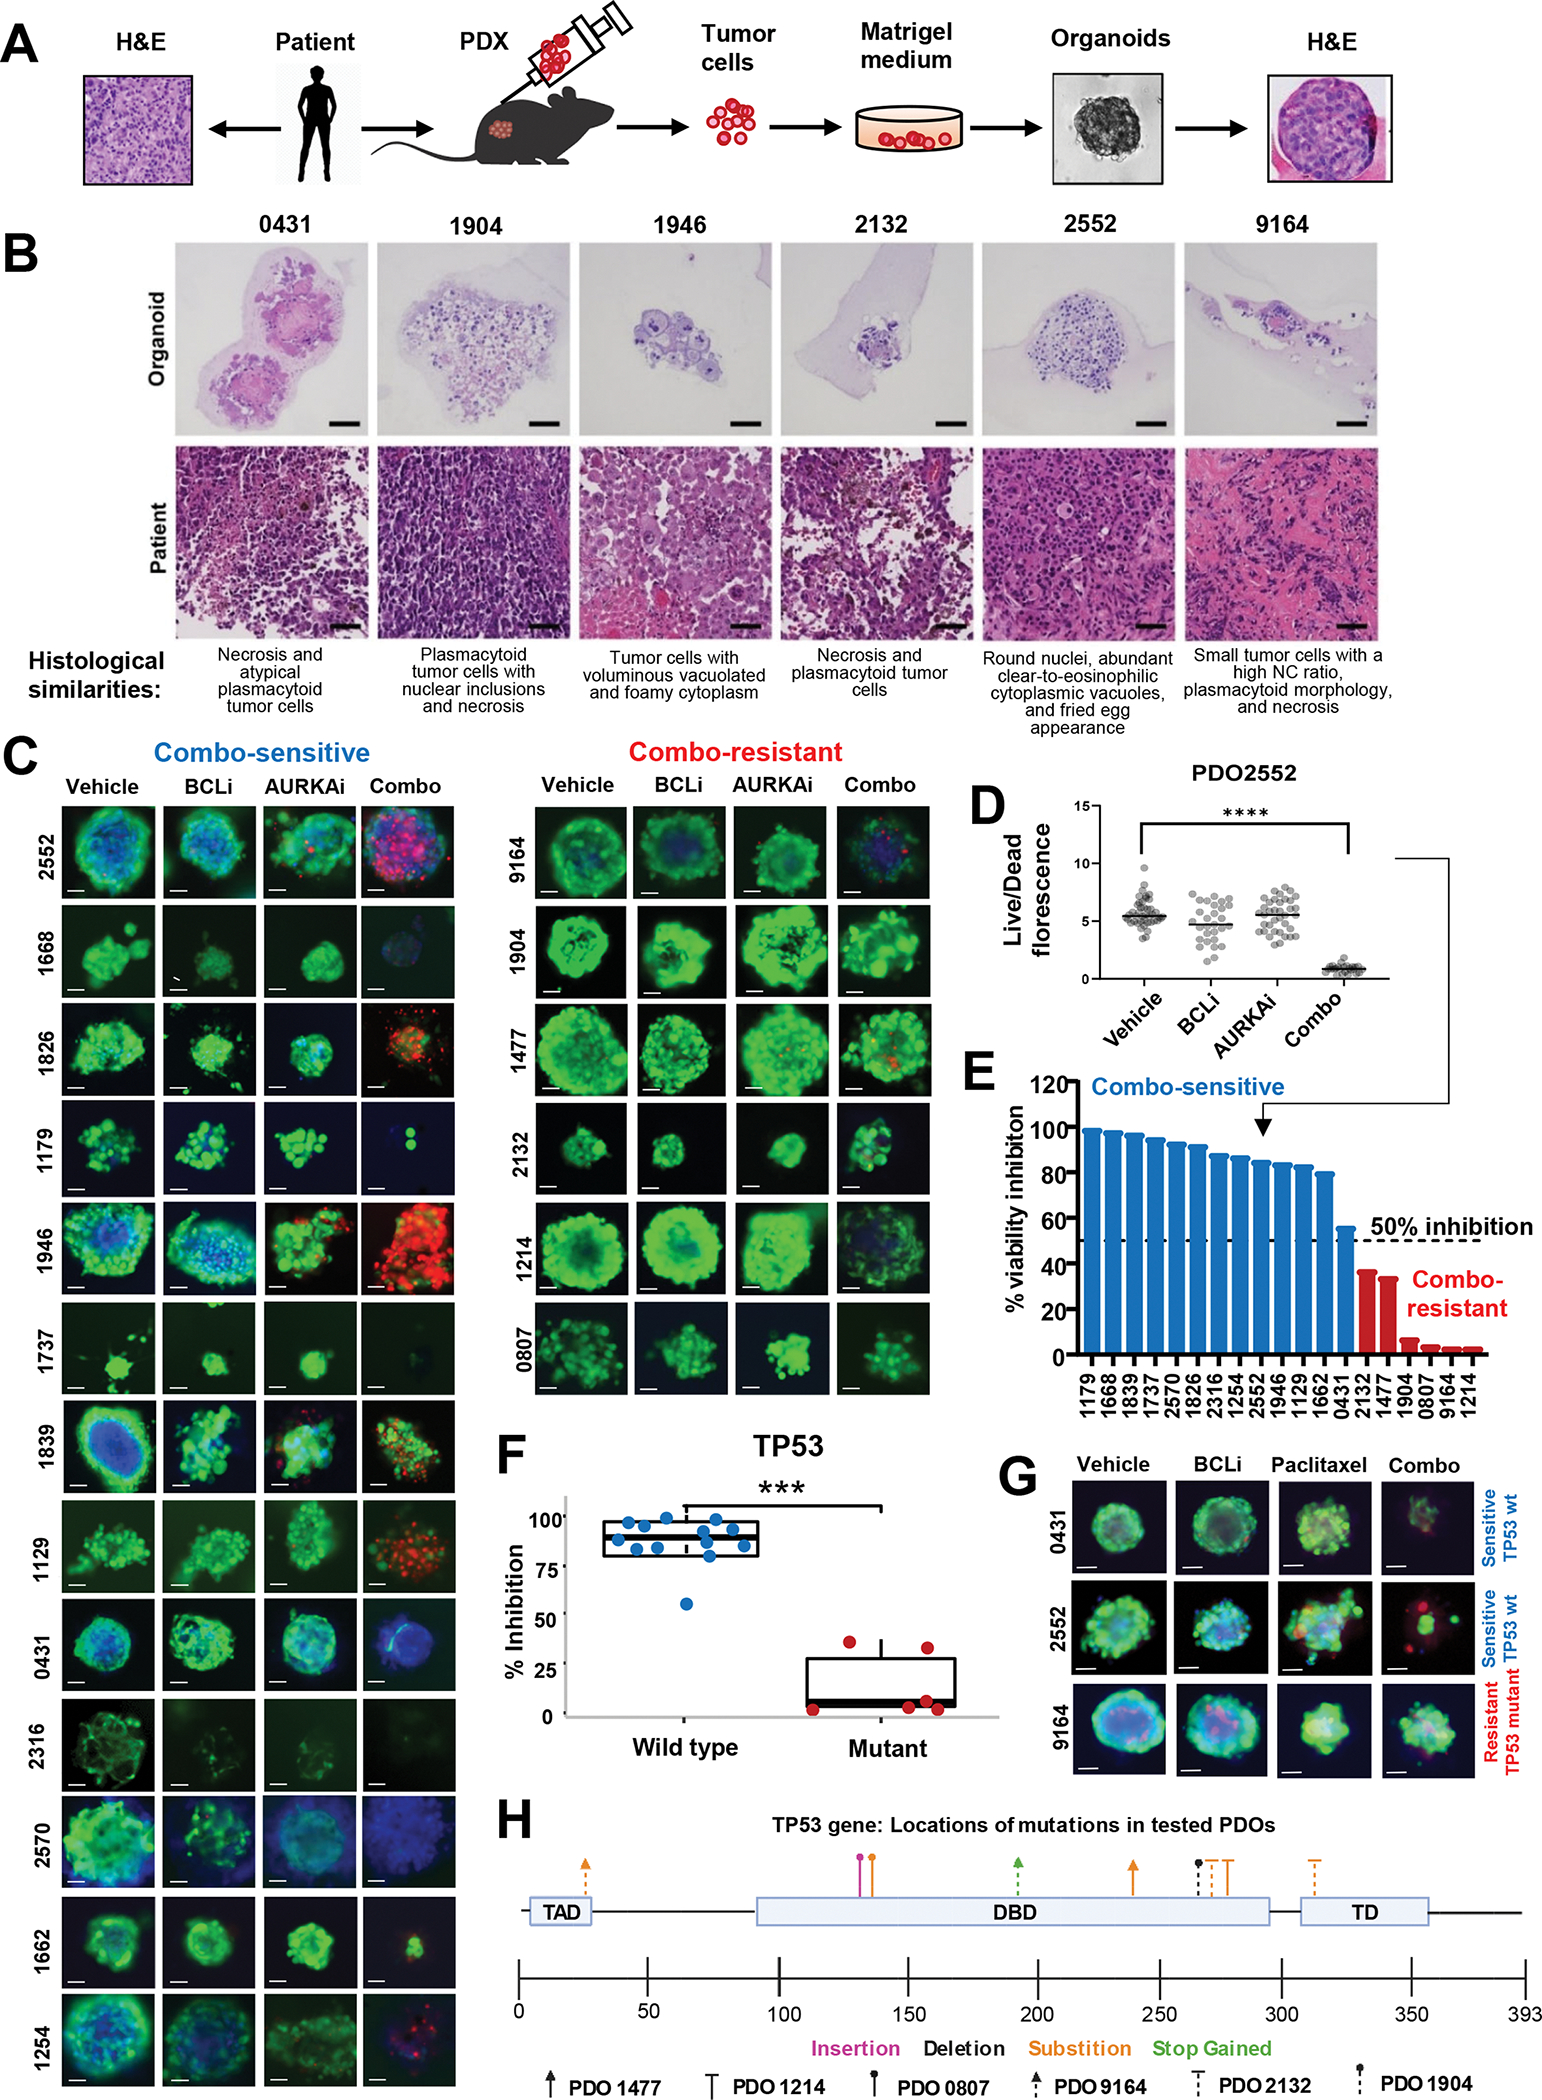
Figure 3. Combined AURKAi and BCLi treatment induced cell death in melanoma PDOs with wild-type p53.

(A) Schematic of the protocol for PDO generation using the fine-needle aspiration technique. (B) H&E staining of indicated PDOs and corresponding original tumor samples. Scale bar 50μm. (C) Representative images of PDOs from 19 distinct melanoma patients treated with vehicle, 1μM navitoclax (BCLi), 1μM alisertib (AURKAi), or both drugs combined for 72 hrs and stained with calcein-AM (live cells), propidium iodide (PI, dead cells), and Hoechst 33342 (DNA dye). Scale bar 50μm. (D) Quantification of the ratios of green/red (live/dead) fluorescent signal in individual organoids for PDO2552 (top left panels in C). See Fig. S1 for data from other 18 PDO models. N=1–40. Statistics using one-way ANOVA with Tukey’s post-test. (E) Stratification of PDOs into sensitive to AURKAi and BCLi co-treatment (combo-sensitive, blue bars) and combo-resistant (red bars) based on data from C. Punctate line indicates a sensitivity cut-off defined as 50% viability inhibition after combo treatment compared to vehicle control. (F) Association of TP53 mutational status and response to alisertib/navitoclax combination based on combo-induced viability inhibition shown in E. Correlation was queried using a two-sample t-test. Blue and red colors of data points represent combo-sensitive and combo-resistant PDOs. See Fig. S2 for response correlation with other genetic markers. (G) Same as C, except PDOs were treated with 0.1μM paclitaxel instead of alisertib. Scale bar 50uM. Blue and red text indicates TP53 mutational status. (H) Schematic representation of the location and types of TP53 mutations present in 19 PDOs used in C. PDOs identified by a unique arrowhead shape while mutation type is color-coded. All panels: Ns - P > 0.05, * - P≤ 0.05, ** - P ≤ 0.01, *** - P ≤ 0.001, **** - P ≤ 0.0001. P-values were adjusted for multiple comparisons. See also Fig. S3, 4.
