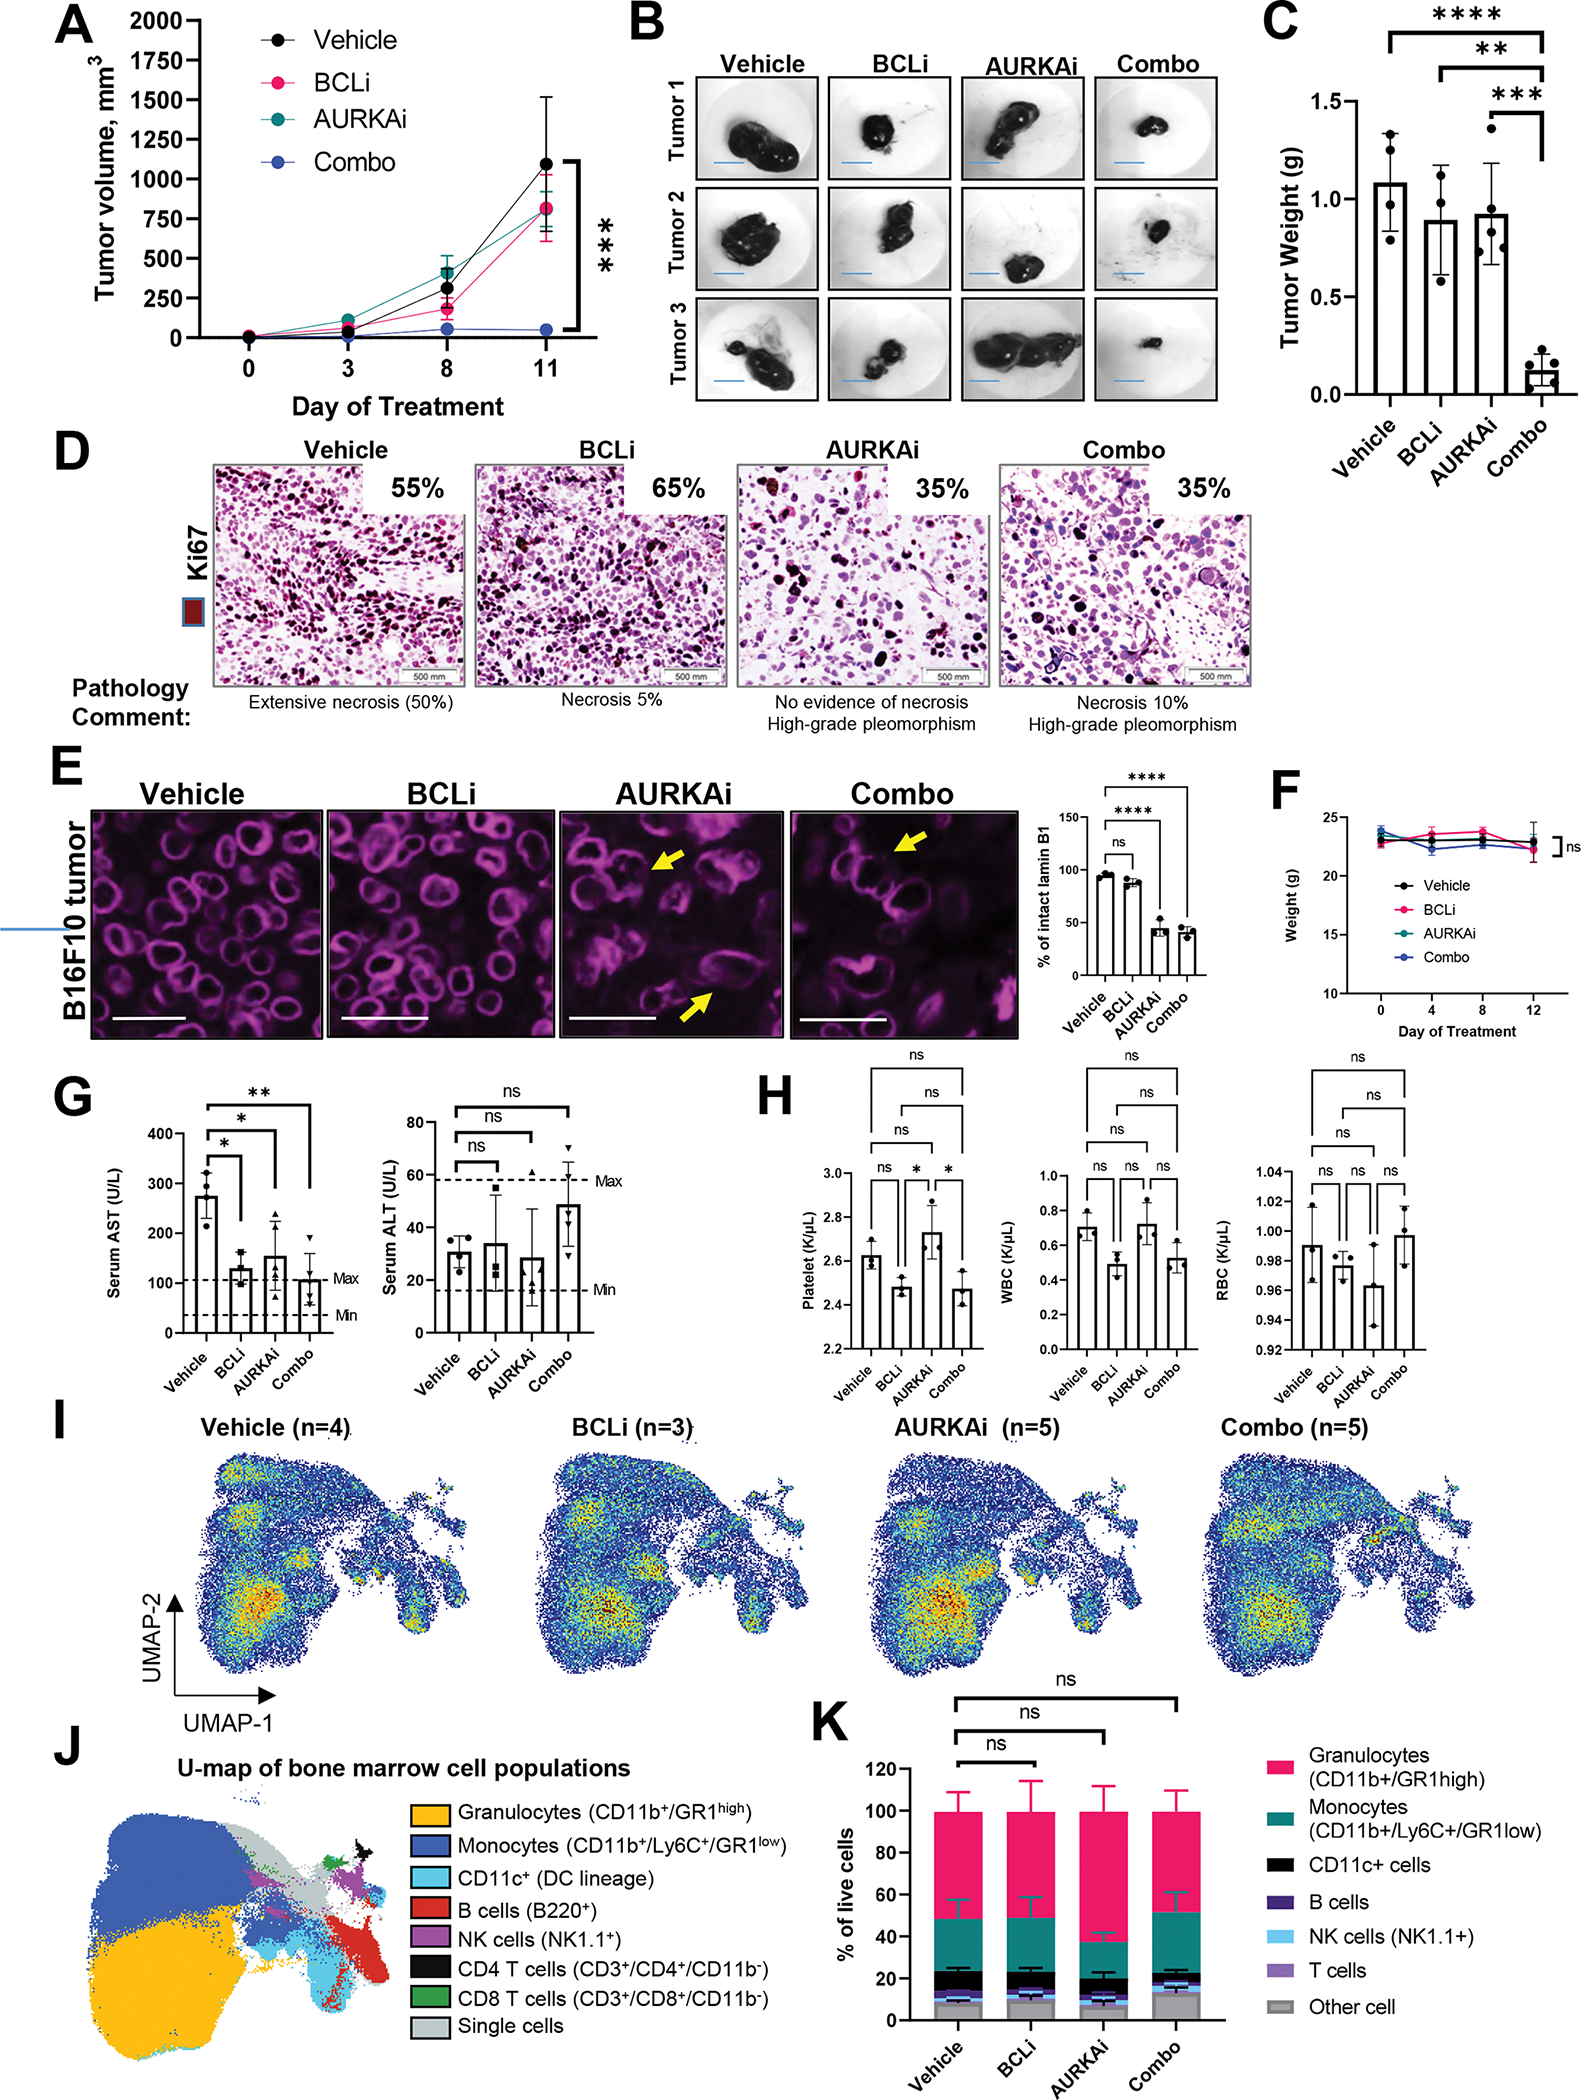
Figure 4. Combination treatment with AURKAi and BCLi blocked melanoma progression in vivo without severe toxicities.

(A) The growth of B16F10 melanoma tumors. Mice were treated with 100 mg/kg navitoclax (BCLi), 25 mg/kg of alisertib (AURKAi), a combination of both drugs (same doses), or drug vehicles for 11 days by daily oral gavage. Data are presented as means ± SEM. N=5 mice per group. Statistical analysis using 2-way ANOVA. Main treatment effects compared to vehicle control were analyzed using Dunnett’s test. (B) Representative images of tumors in A. Scale bar 8mm. (C) Tumor weight from the experiment in A. Statistics using ANOVA with Dunnett’s test. N=3–5 mice. (D) Representative images of Ki67 IHC in tumors shown in A. Inserts indicate the percentages of Ki67+ cells across the slides determined by a dermatopathologist. (E) Immunofluorescence (IF) staining of Lamin B1 in B16F10 tumors shown in A. Arrows indicate representative cells with disrupted Lamin B1 nuclear border. Scale bar 25 μm. Statistical analysis using ANOVA with Dunnett’s test. (F) Body weight changes during the treatment. Statistical analysis as in A. (G) Serum levels of AST and ALT in mice shown in A. Data are presented as individual data points, means ± SEM. Statistical analysis using 1-way ANOVA with Tukey’s post-test. N=3–5 mice. (H) Blood counts of platelet, white and red blood cells (WBC and RBC). Statistical analysis was performed using ANOVA with Dunnett’s post-test. (I) Effect of indicated treatments on bone marrow cell populations in mice shown in A analyzed by spectral cytometry and UMAP dimension reduction algorithm. Samples were concatenated based on treatment. (J) Main bone marrow cell populations were identified based on marker expression indicated in parenthesis and projected on two UMAP dimensions shown by overlay plots. (K) Bone marrow composition in mice from the indicated treatment group. Statistical analysis using 2-way ANOVA. Main treatment effects compared to vehicle control were analyzed using Dunnett’s multiple comparisons test. All panels: Ns - P > 0.05, * - P≤ 0.05, ** - P ≤ 0.01, *** - P ≤ 0.001, **** - P ≤ 0.0001. P-values were adjusted for multiple comparisons. See also Fig. S5.
