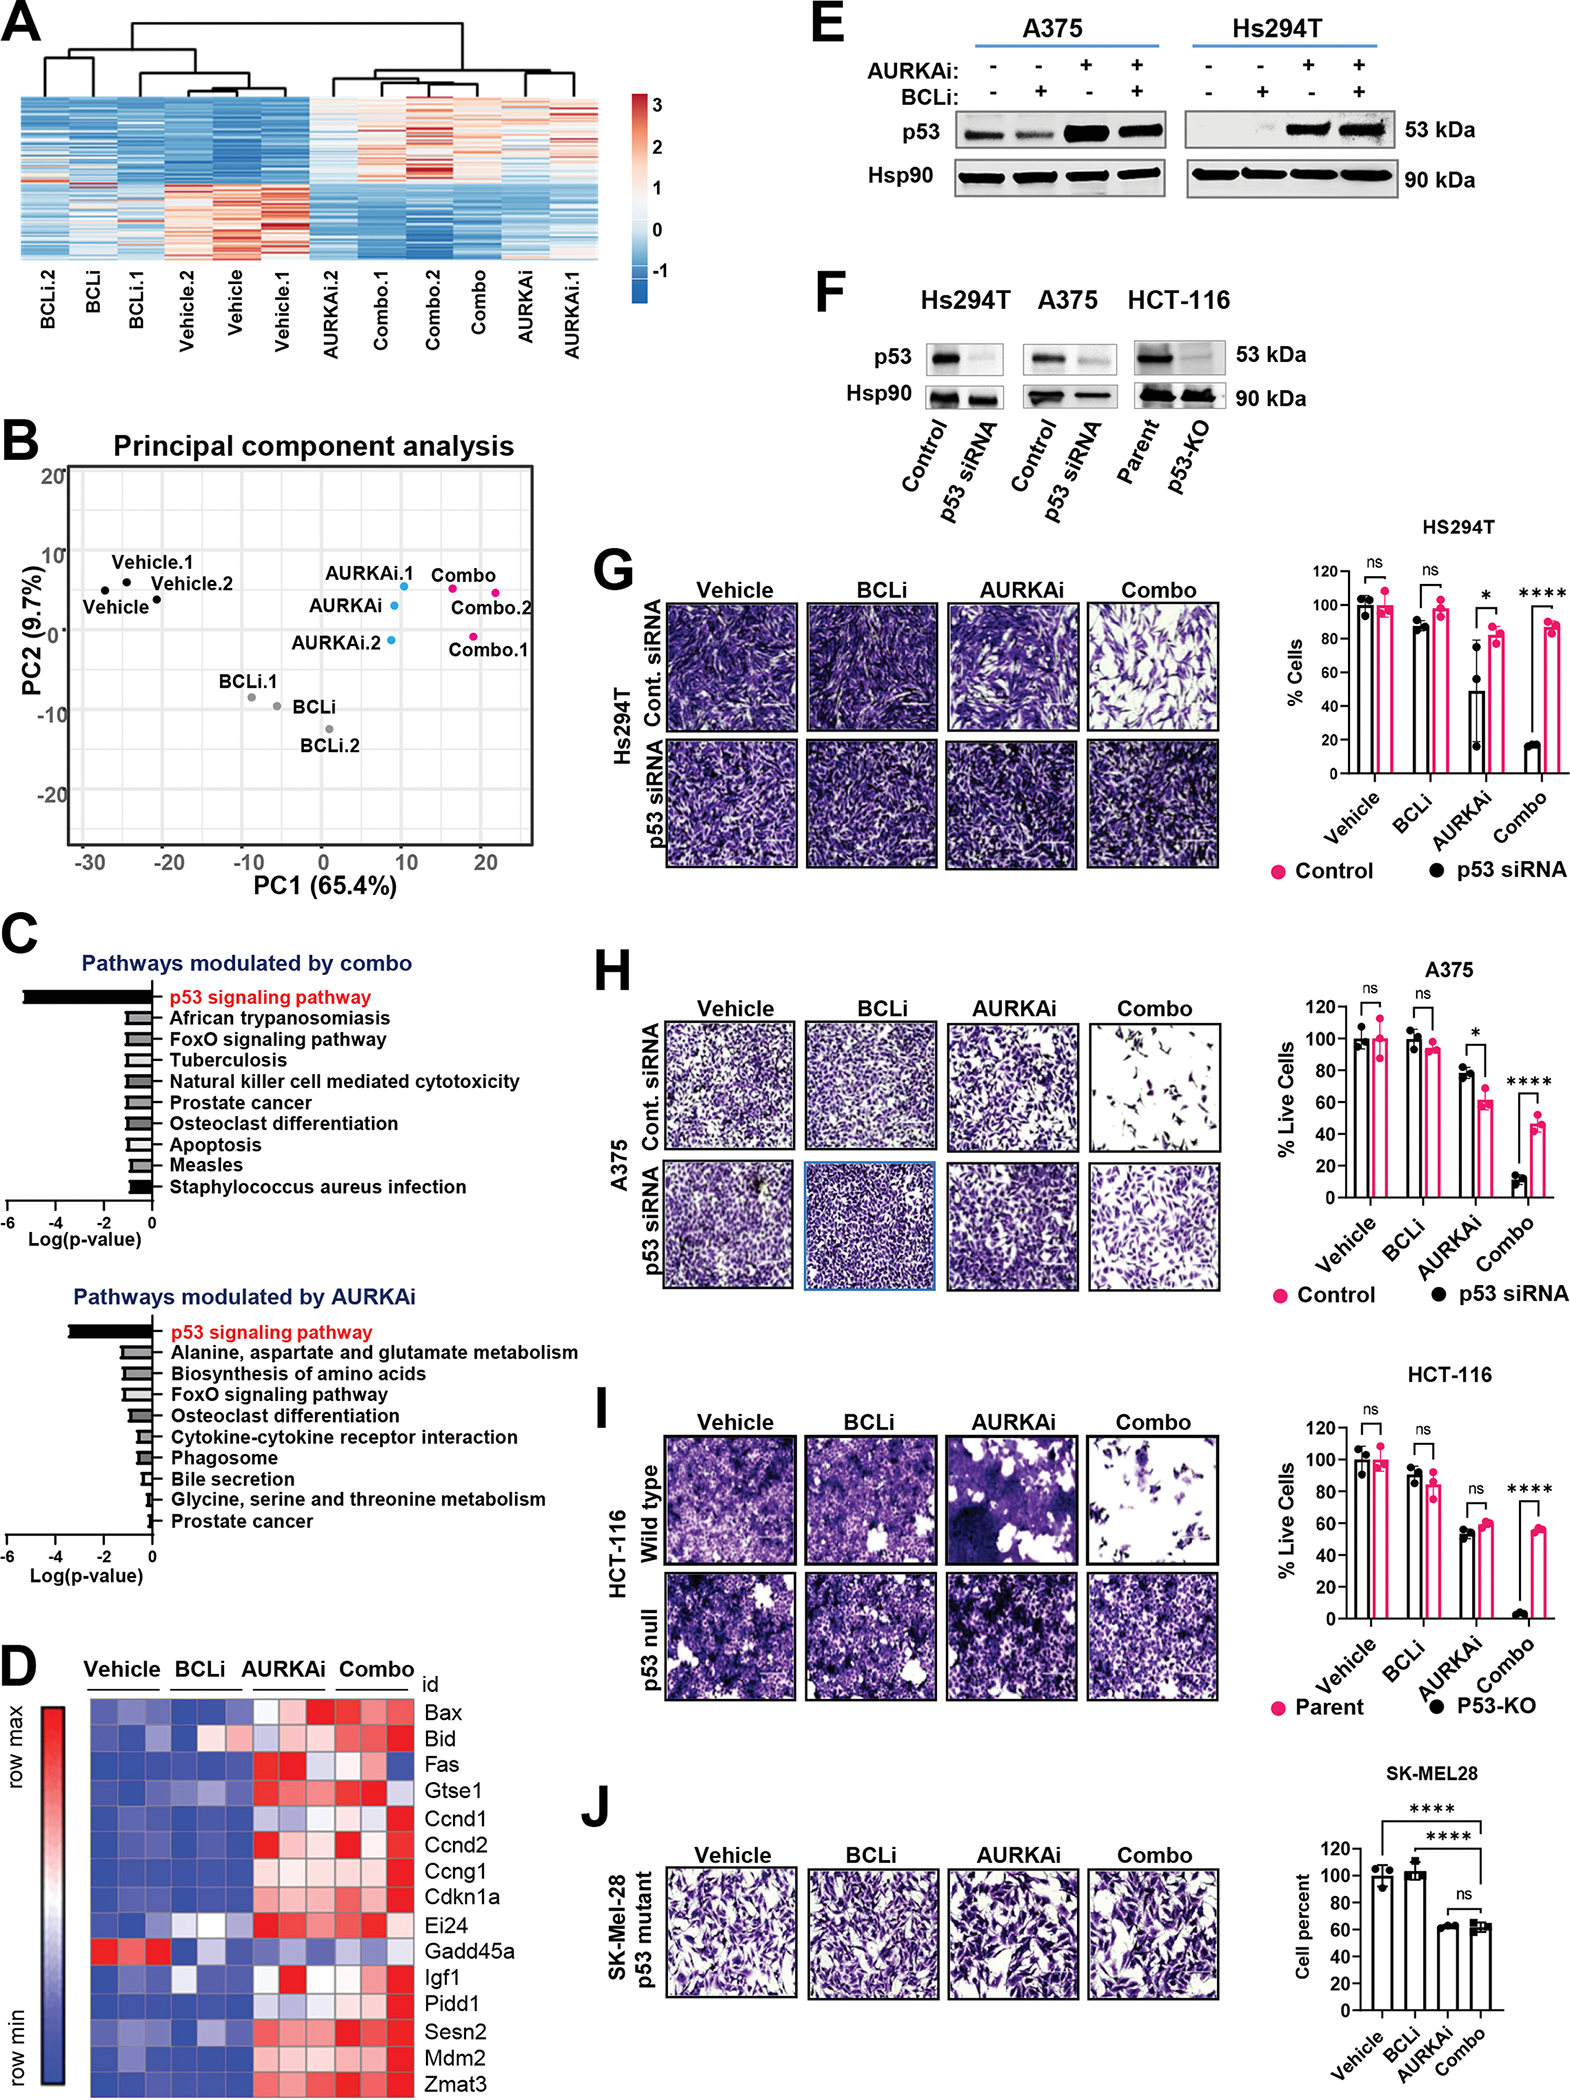
Figure 5. AURKAi activated the p53 transcriptional program.

(A) RNAseq of tumors shown in Fig. 4A. The heat map of genes modulated by either combined AURKAi and BCLi treatment or corresponding individual treatments. N=3. Rows are centered; unit variance scaling is applied to rows. Both rows and columns are clustered using correlation distance and average linkage. (B) Results of the principal component analysis of gene expression data sin A. (C) Top 10 KEGG pathways enriched within the genes differentially expressed after combo (top panel) and alisertib (bottom panel) treatments. Log10-transformed Benjamini-adjusted p-values were plotted. (D) The heat map shows relative mRNA expression of genes within the KEGG p53 signaling pathway across. “Row max” corresponds to the highest expression value of a protein in this row across all tested samples. “Row min” is expression in the sample with lowest expression value. (E) Western blot analysis of p53 protein in melanoma cells treated with vehicle, 1μM navitoclax (BCLi), 1μM alisertib (AURKAi) or combination for 24 hrs. Three independent experiments were performed with consistent results. (F) Western blot shows the efficiency of p53 knockdown/knockout. (G) Representative images and quantificationof crystal violet-stained Hs294T melanoma cells transfected with p53 siRNA or non-targeting siRNA and treated as described in E. Scale bar 200μm. N=3. Statistical analysis using one-way ANOVA with Sidak’s post- test. Two independent experiments were performed with consistent results. (H) Same as G, except A375 cells were used. (I) Representative images and quantification of crystal violet-stained HCT-116 wild-type and p53-null cells treated as in E. Scale bar 200μm. Statistical analysis as in G. (J) Representative images and quantification of Sk-Mel-28 cells with mutated TP53 treated as in E. Scale bar 200μm. Statistical analysis using one-way ANOVA with Dunnett’s test. (All panels) Ns - P > 0.05, * - P≤ 0.05, ** - P ≤ 0.01, *** - P ≤ 0.001, **** - P ≤ 0.0001. P-values were adjusted for multiple comparisons.
