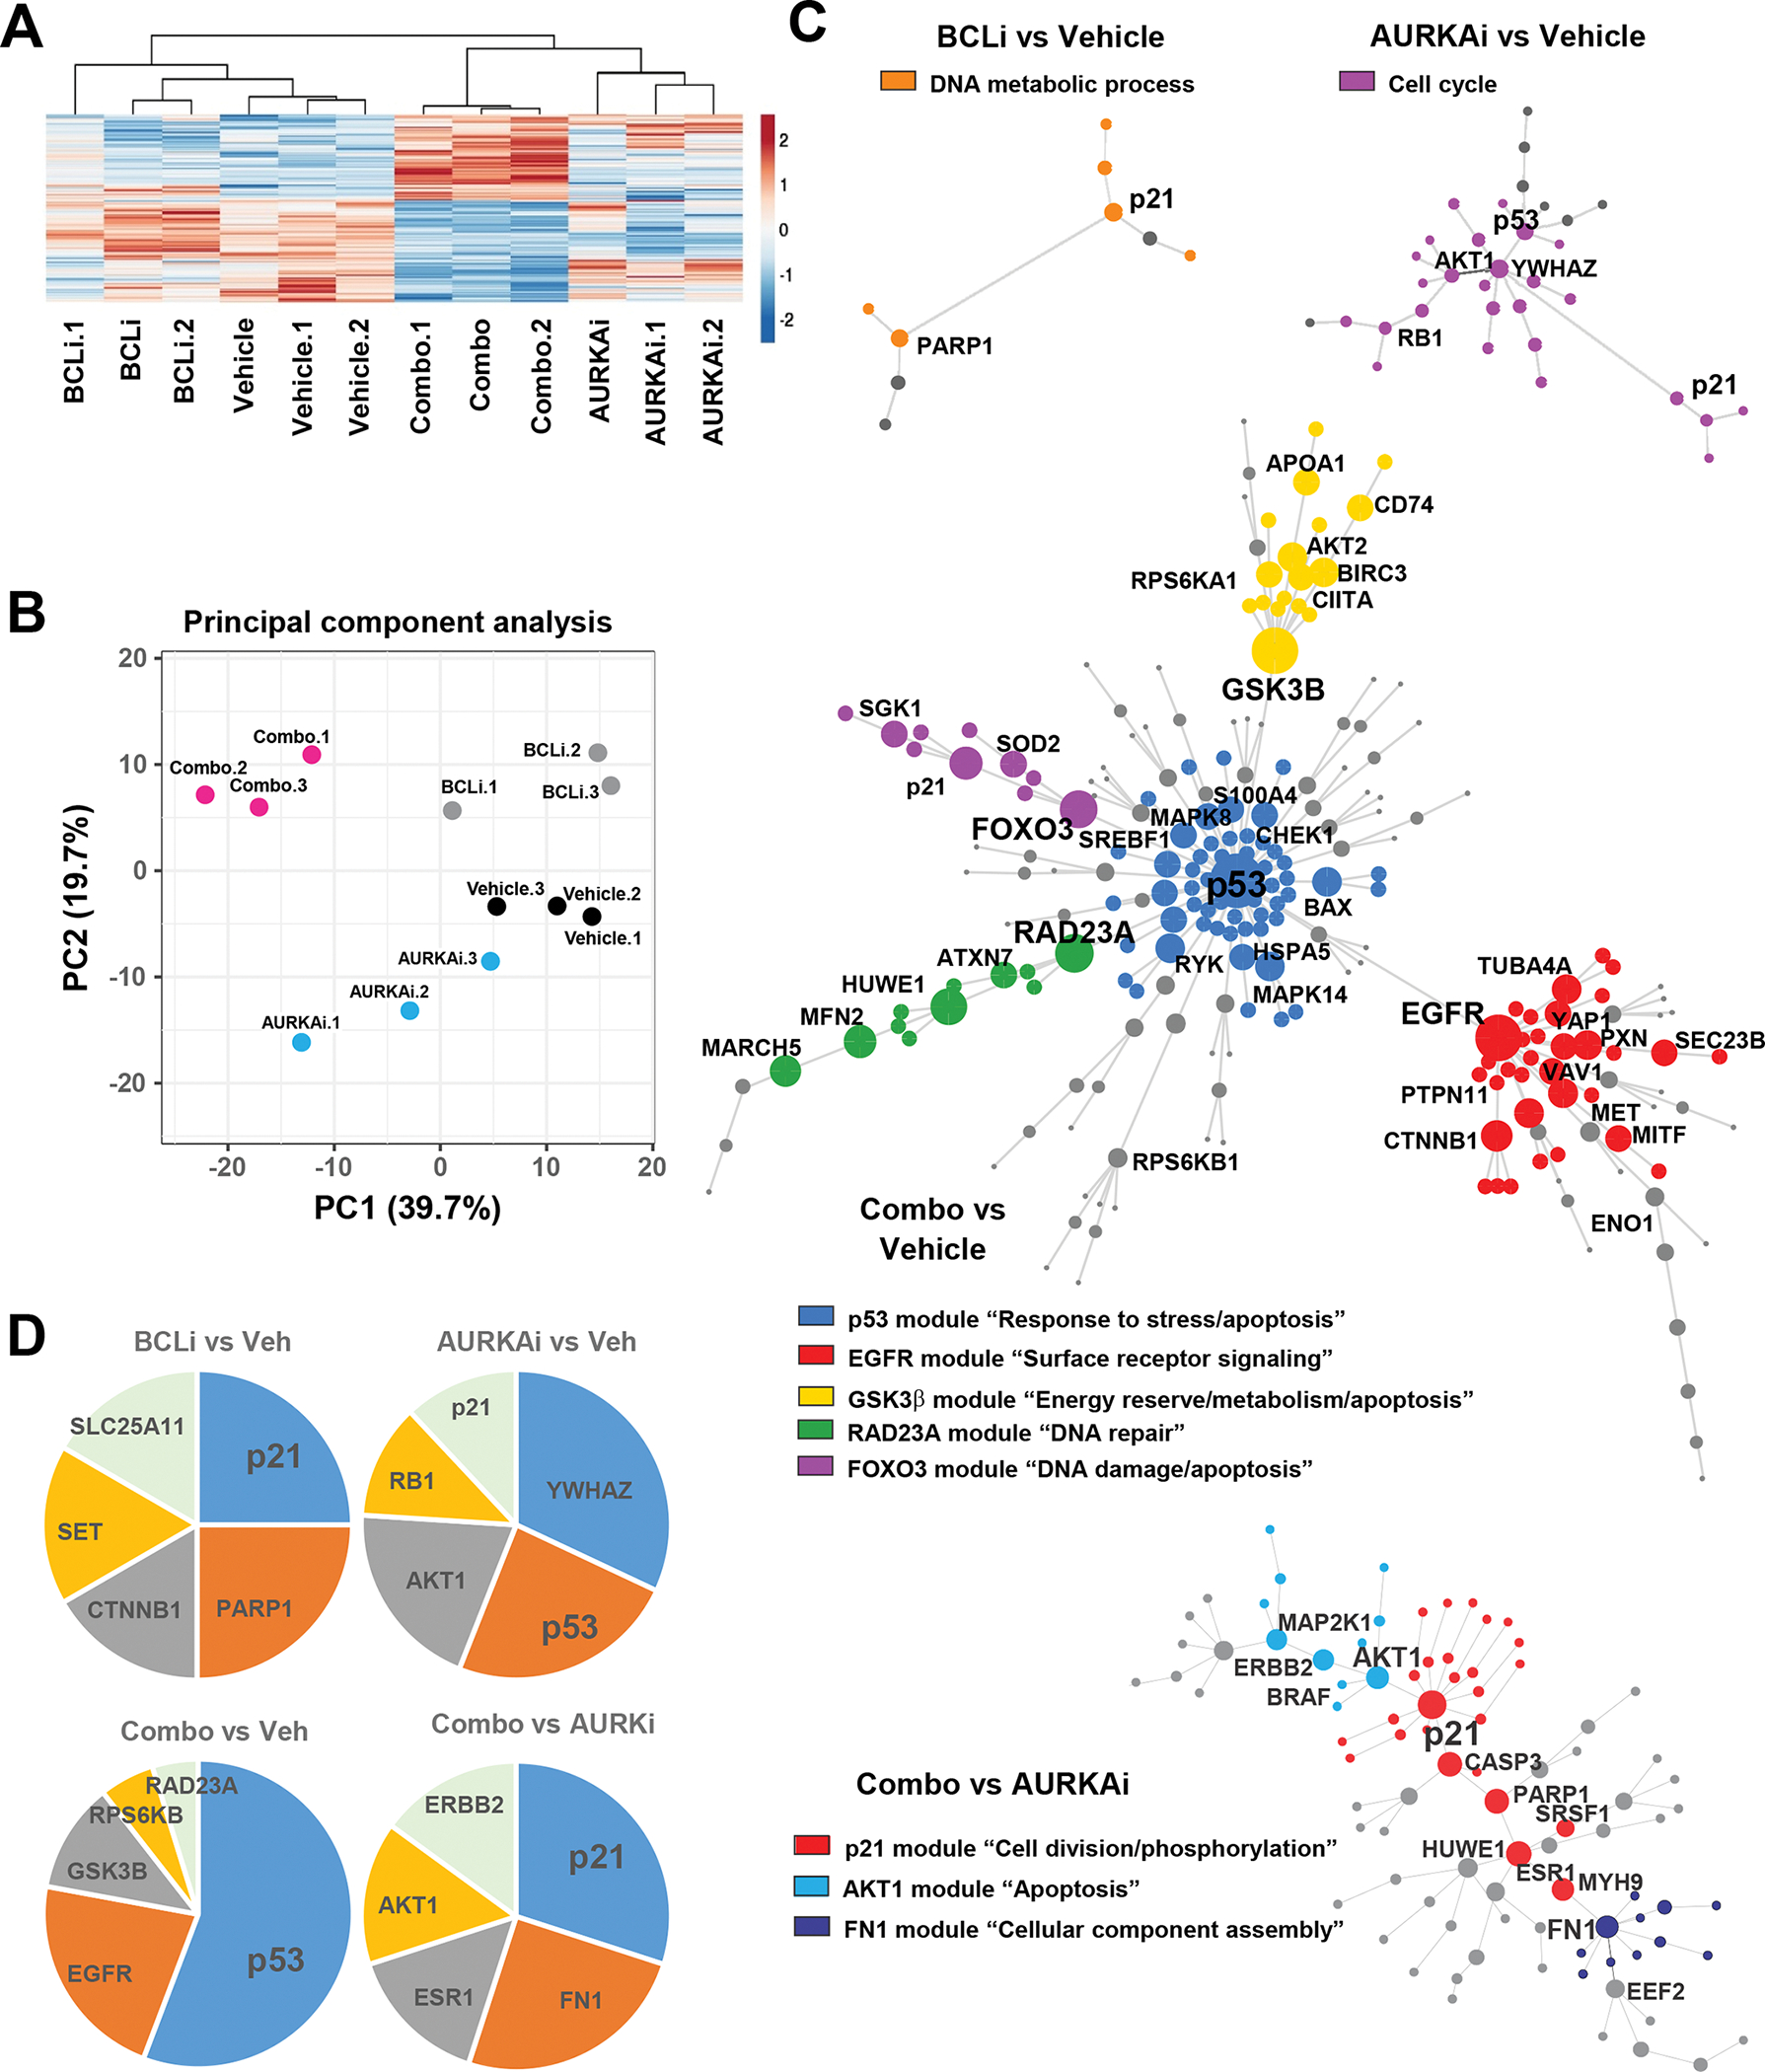
Figure 6. The addition of BCLi caused extensive proteome remodeling in AURKAi-treated cells.

Reverse phase proteomic analysis (RPPA) of A375 melanoma cells treated with vehicle, 1μM navitoclax (BCLi), 1μM alisertib (AURKAi) or both drugs for 24 hrs. (A) Heat map shows proteins significantly modulated by AURKAi and BCLi treatment. N=3. Rows are centered; unit variance scaling is applied to rows. Rows and columns are clustered using correlation distance and average linkage. (B) Principal component analysis of protein expression data shown in A. (C) Protein networks constructed based on data in A. Circles represent individual proteins differentially expressed in pairwise-compared groups. Connecting lines represent known/validated protein-protein interactions. The size of individual circles reflects how many connections this protein has with other network proteins. Colors indicate distinct modules (groups of interconnected proteins), and legends indicate GO annotations enriched within this module. (D) Relative connectivity of top five most connected proteins within the networks shown in C.
