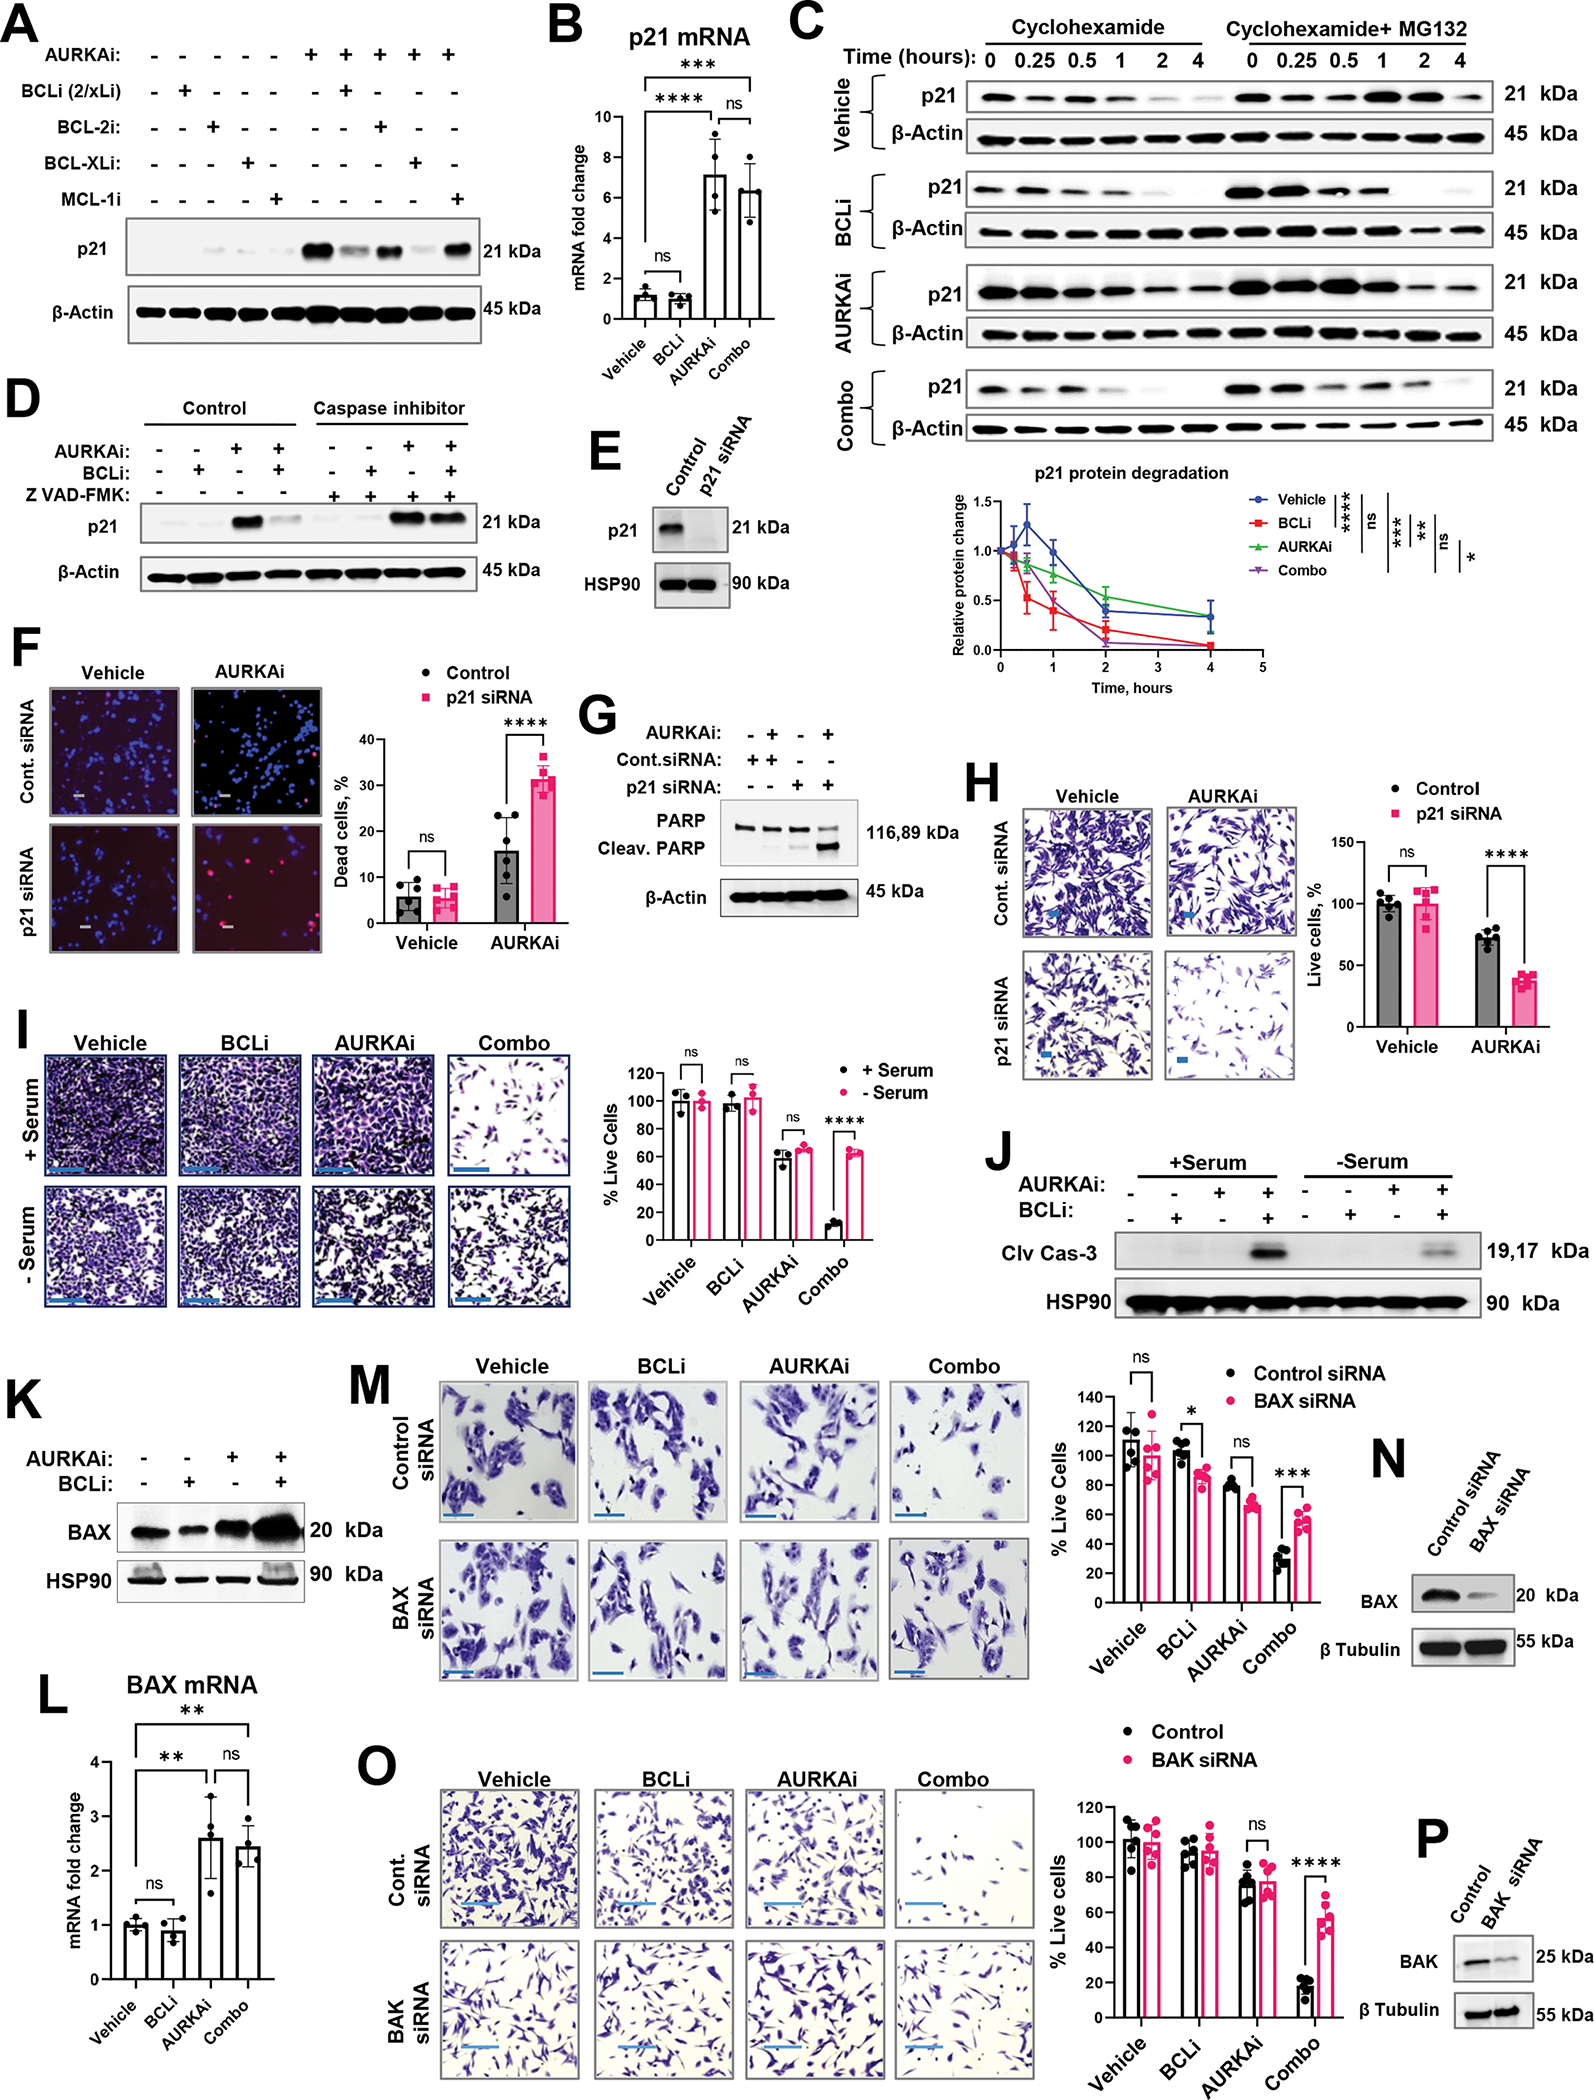
Figure 7. Differential modulation of p53 targets regulated cellular response to AURKAi and BCLi therapy.

(A) Western blot of p21 in A375 melanoma cells treated with 1μM navitoclax (BCL-2/xLi), 1μM venetoclax (BCL-2i), 1μM A-1155463 (BCL-xLi), 1μM A-1210477 (MCL-1i) in the presence or absence of 1μM alisertib (AURKAi) for 24hrs. Experiment was repeated three times with consistent results. (B) Real-time PCR of relative CDKN1A (p21) mRNA expression in A375 cells after 24hrs of treatment with vehicle, 1μM navitoclax (BCLi), 1μM alisertib (AURKAi), or combination of both drugs. The experiment was repeated three times with 2 replicates each. Statistical comparison using one-way ANOVA with Tukey’s post- test. (C) Western blot analysis of p21 degradation. A375 melanoma cells were treated as in B for 16hrs followed by the addition of Cycloheximide (150μg/ml) ± MG-132 (1μM). Cell lysates were collected at indicated time points (0.25h – 4h). P21 bands from 3 independent experiments were quantified using densitometry and normalized to corresponding actin bands and plotted on the graph below. The square root transformation was used to correct for heteroscedasticity. Statistical analysis using 2-way ANOVA with Tukey’s post-test. (D) Western blot in A375 cells treated as in B for 24hrs in the absence or presence of pan-caspase inhibitor Z-VAD-FMK (20 μg/ml). Three independent experiments were performed with consistent results. (E) Western blot analysis of p21 knockdown. (F) Representative images of Hs294T cells transfected with p21-targeting or non-targeting siRNA, treated with vehicle or 1μM alisertib (AURKAi) for 24hrs, and stained with Hoechst and PI. Scale bar 50μm. Experiment was performed with 3 biological replicates. Right: data quantification from 6 random fields (n=6) and statistics by 2-way ANOVA with Sidak’s post-test. (G) Western blot analysis of cleaved PARP in Hs294T cells treated as in F. (H) Cristal violet staining in Hs294T cells treated as in F. Statistical analysis as in F. (I) Representative images and quantification of crystal violet-stained A375 cells treated as in B for 24hrs in serum-containing (+ serum, control culture condition) and serum-free (- serum, cell cycle-arresting conditions) media. Scale bar 200μm. Statistical comparisons using one-way ANOVA with Sidak’s post-test. N=3 biological replicates. (J) Western blot analysis of cleaved caspase 3 in A375 cells treated as described in I. Experiment was repeated twice with consistent results. (K) Western blot of BAX protein expression in A375 cells treated with vehicle, 1μM navitoclax (BCLi), 1μM alisertib (AURKAi), or their combination for 16hrs. Three independent experiments were performed with consistent results. (L) Real-time PCR analysis of BAX mRNA in A375 cells treated as in B for 24hrs. Experiment was repeated two times with two replicates each. Statistical analysis using one-way ANOVA with Tukey’s post-test. N=4. (M) Representative images of crystal violet-stained A375 cells transfected with non-targeting and BAX-targeting siRNA. Scale bar 150μm. Two independent experiments were performed with consistent results. Right: quantified cell numbers and statistical comparison using one-way ANOVA with Sidak’s post-test. N=6. (N) Western blot for BAX siRNA efficiency. (O-P) Same as M and N, except BAK-specific siRNA was used. All panels: Ns - P > 0.05, * - P≤ 0.05, ** - P ≤ 0.01, *** - P ≤ 0.001, **** - P ≤ 0.0001. P-values were adjusted for multiple comparisons. See also Fig. S6.
