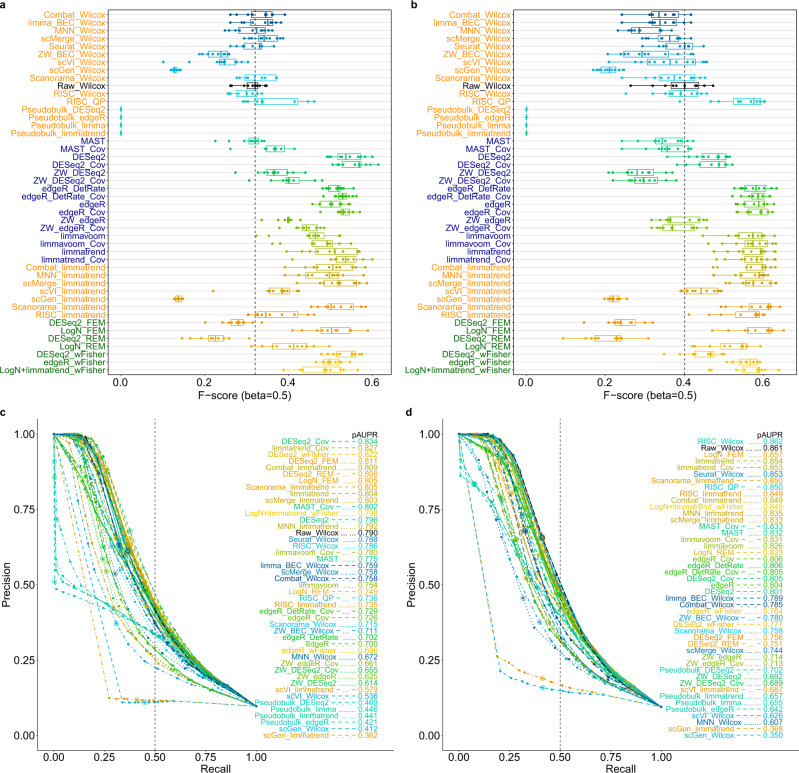
Fig. 3. Model-based simulation results for low depths (depth-10 and depth-4; zero rate >80%).
F0.5-scores for 46 differential expression (DE) workflows for (a) depth-10 and (b) depth-4. Results for six cell proportion scenarios (12 instances in total: six for upregulated genes and six for downregulated genes) are represented as boxplots; the lower, center and upper bars represent the 25th, 50th and 75th percentiles, respectively, and the whiskers represent ± 1.5 × interquartile range. The vertical dotted lines (black) indicate the median F0.5-score of Wilcoxon test (Raw_Wilcox). Precision-recall curves for c depth-10 and d depth-4. The partial areas under the curve for recall rate <0.5 (pAUPRs) are computed and sorted in descending order in the legends. The vertical dotted lines (black) indicate the recall rate of 0.5. The precision-recall pairs that correspond to q-value = 0.05 in each DE workflow are circled. n = 1000 cells were used for each test case.

