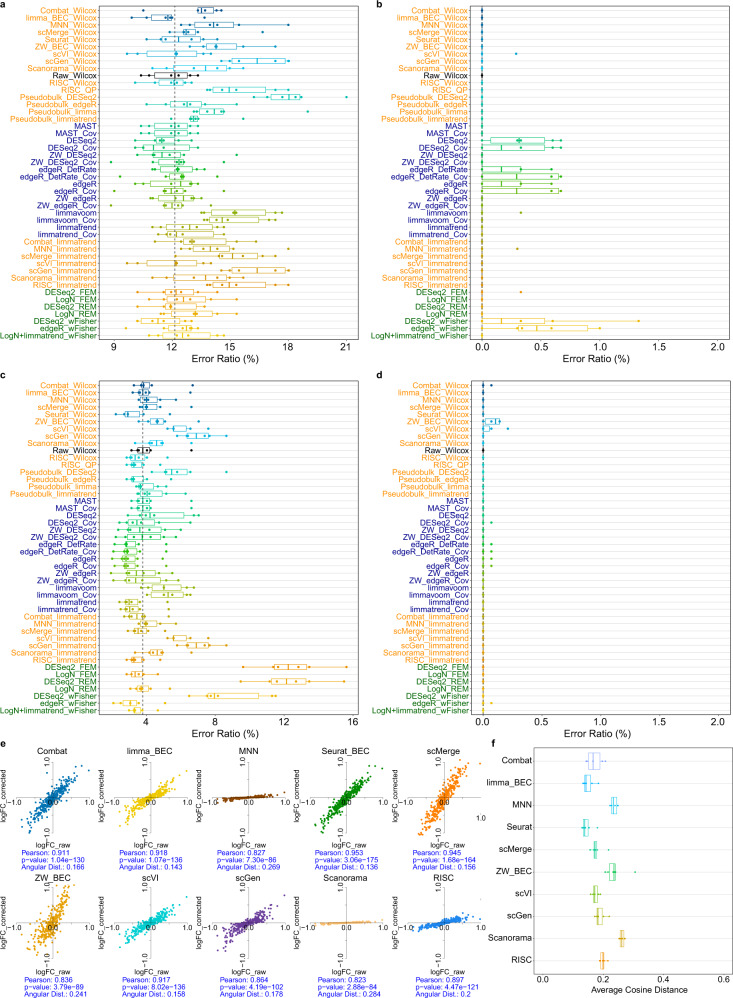
Fig. 4. Distortion analysis for differential expression (DE) workflows.
a Proportion of DE genes that altered their signs by each DE workflow (error ratios) for model-based simulation (two batches; large batch effects; depth-77). b Error ratios for the model-based simulation for only significantly detected DE genes (q-value <0.05). The vertical dotted lines (black) indicate the median error ratio of Wilcoxon test (Raw_Wilcox). c Error ratios for pancreatic alpha-cell (model-free) simulation data. d Error ratios for the pancreatic alpha-cell data for only significantly detected DE genes. e A scatterplot of the logFC values for the model-based simulation data with a moderate depth (depth-77) before (logFC_raw) and after (logFC_corrected) applying batch-effect correction (BEC) methods: Combat, limma (limma_BEC), MNNCorrect, Seurat_BEC, scMerge, ZINB-WaVE (ZW_BEC), scVI, scGen, Scanorama and RISC. Pearson correlation, its p-value and the angular cosine distance (Angular Dist) of scatter plot are shown for each BEC method. f The distortion levels for the moderate depth data as measured by the angular cosine distance from the logFC scatterplot for six cell proportion scenarios. The lower, center and upper bars of each boxplot represent the 25th, 50th and 75th percentiles, respectively, and the whiskers represent ± 1.5 × interquartile range. n = 1050 cells were used in a, b, e, f, and n = 900 cells were used in c and d.

