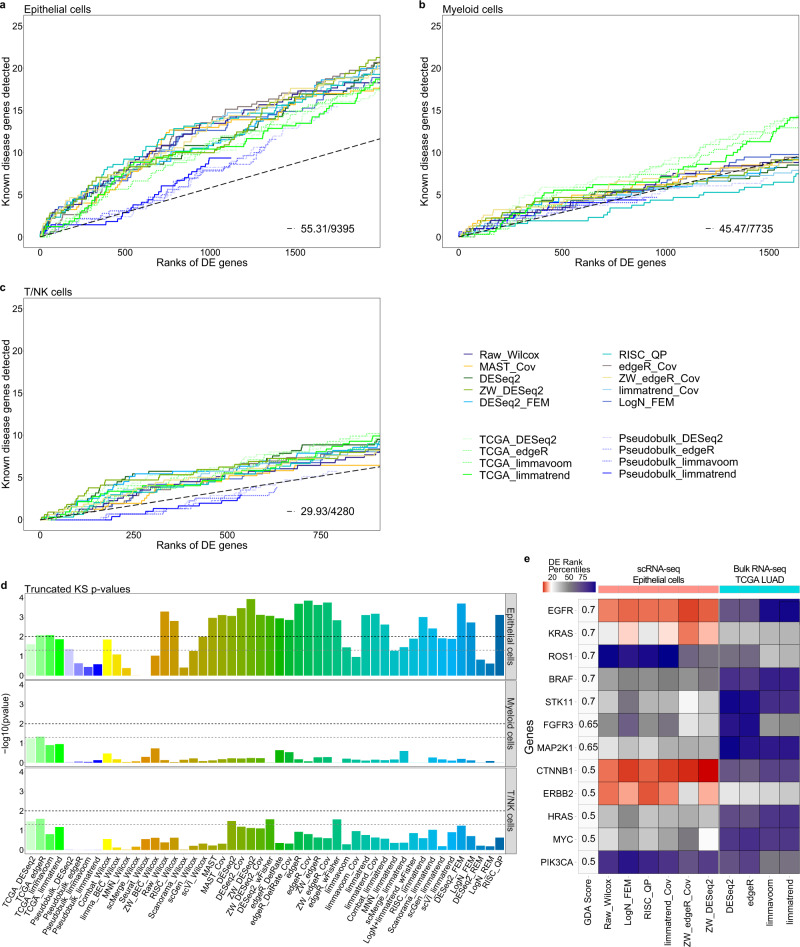
Fig. 6. Comparison of predictive powers for lung adenocarcinoma (LUAD) genes between differential expression (DE) workflows for scRNA-seq and bulk RNA-seq data.
Cumulative disease gene scores (GDA scores) for known disease genes up to top 20% DE gene ranks are shown for three cell types: a epithelial cells, b myeloid cells and c T/NK cells. X-axis represents the DE gene ranks in each DE analysis. Y-axis represents the cumulative score of known disease genes captured within top-k gene ranks by each DE analysis. The black-dashed slopes represent the expected cumulative scores of known disease genes for random gene ranks. Ten and four methods are selected for analyzing scRNA-seq and bulk/pseudobulk data, respectively. d p-values of truncated Komogorov-Smirnov (KS) test for DE analyses of scRNA-seq and TCGA RNA-seq data are shown for the three cell types. Black and gray dashes represent the two significance cutoffs p-values = 0.01 and = 0.05, respectively. e Rank percentiles of the 12 known LUAD genes with GDA score no less than 0.5 are visualized for six DE workflows applied to LUAD epithelial cells and four bulk sample DE methods applied to TCGA LUAD data. n = 7728, 17348, and 15293 cells were used for the analysis of epithelial, myeloid, and T/NK scRNA-seq data, respectively.

