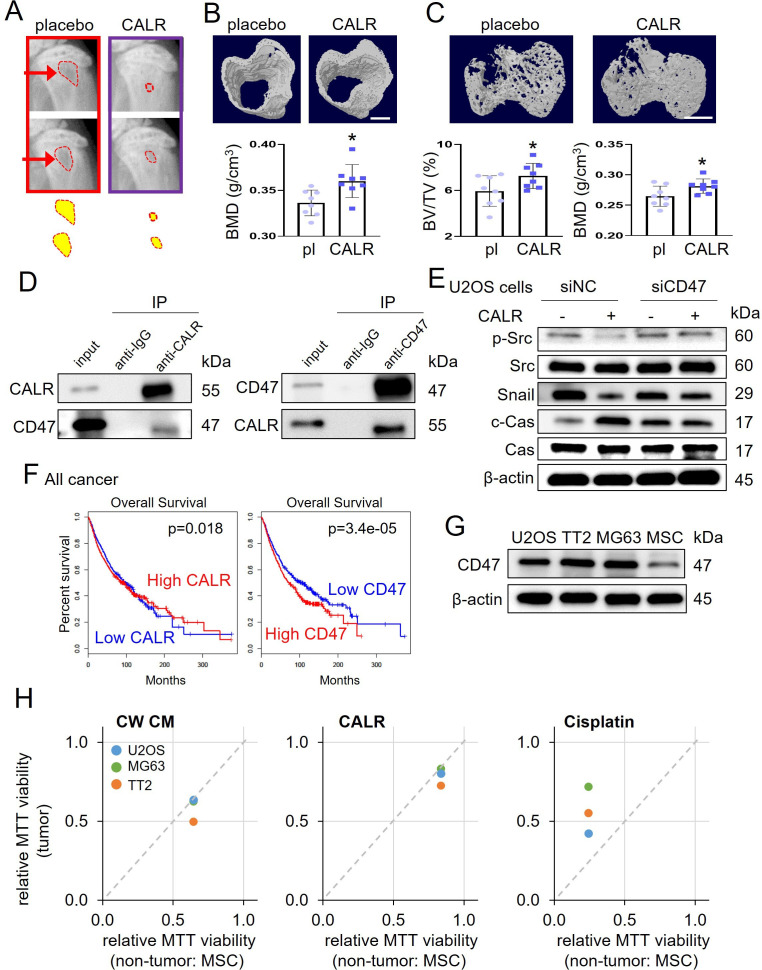
Figure 5. Calreticulin’s action on tumor-invaded bone and its interaction with CD47.
The single asterisk indicates p<0.05. CALR = calreticulin, pl = placebo, siNC = nonspecific siRNA, siCD47=CD47 siRNA, CW CM = CW008-treated MSC conditioned medium, and Cas = caspase 3. (A) X-ray images of the proximal tibia of NSG mice that received inoculation of TT2 OS cells. (B) MicroCT image-based increase in BMD (bone mineral density) of cortical bone in the proximal tibia (N=8) of NSG mice by daily injection of calreticulin (10 μg/kg). (C) MicroCT image-based increase in BV/TV (bone volume ratio) and BMD of trabecular bone of NSG mice in the proximal tibia (n=8). (D) Reciprocal co-immunoprecipitation of calreticulin and CD47 using TT2 osteosarcoma (OS) cell lysate. (E) Suppression of calreticulin-induced changes of p-Src, Snail, and cleaved caspase 3 (c-Cas) in U2OS cells by silencing CD47. (F) Favorable %survival with a high level of calreticulin and a low level of CD47 in all cancer patients. (G) Elevated expression level of CD47 in three OS cell lines (U2OS, TT2, and MG63), compared to non-OS cells (MSCs). (H) Tumor selectivity, larger than 1 for CW008-treated MSC CM and calreticulin, indicating the selective inhibition of OS cells (TT2, U2OS, and MG63) compared to MSCs. Of note, tumor selectivity for cisplatin, smaller than 1, indicates cisplatin’s non-selective inhibition of tumor and non-tumor cells. (Scale bar, 1 mm, error bars indicate standard deviation.)
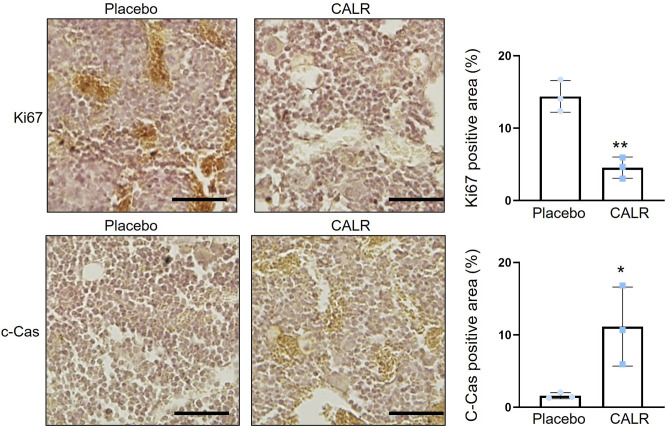
Figure 5—figure supplement 1. Downregulation of Ki-67 and upregulation of cleaved caspase 3 in tumor-invaded bone sections by the administration of calreticulin.
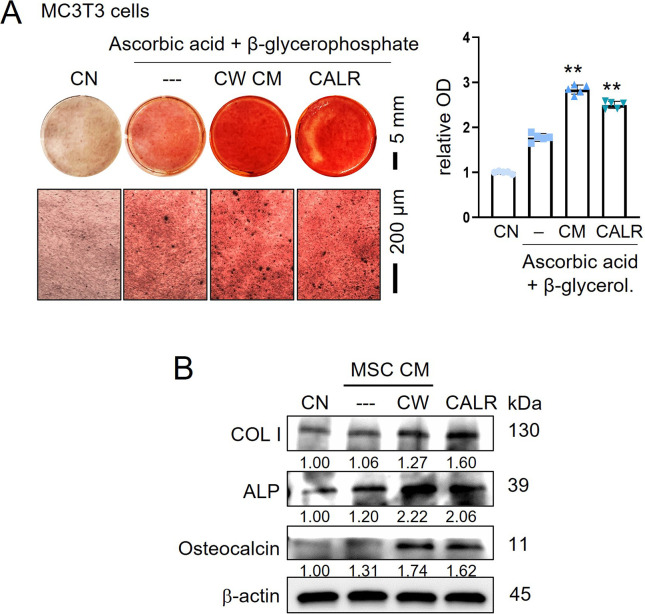
Figure 5—figure supplement 2. Stimulation of osteoblast differentiation by CW008-treated bone marrow-derived MSC CM (CW-MSC CM) and calreticulin.
Figure 5—figure supplement 3. Silencing the CD47 in U2OS cells.
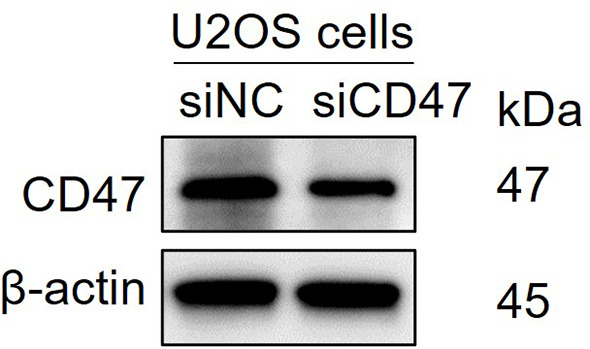
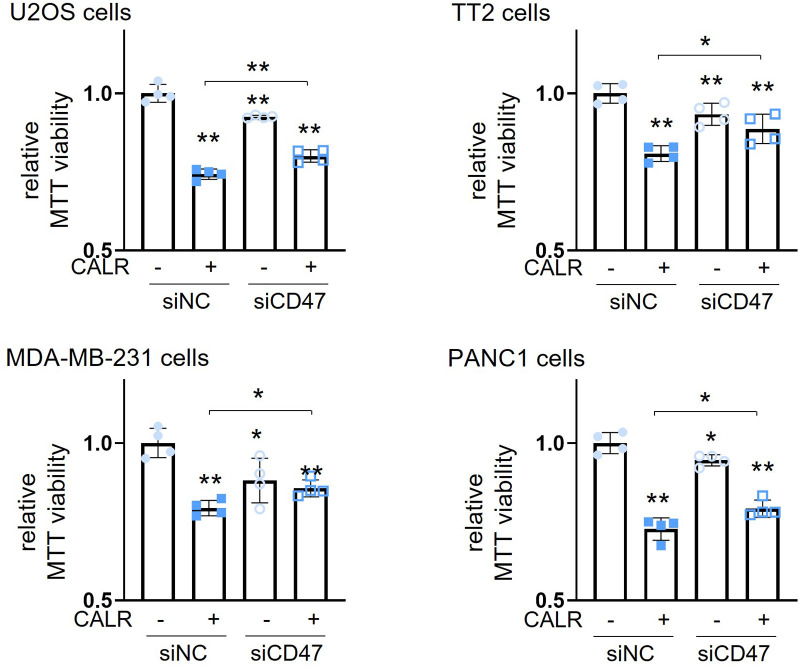
Figure 5—figure supplement 4. Suppression of CALR-driven decrease in MTT-based viability of U2OS osteosarcoma (OS) cells, TT2 OS cells, MDA-MB-231 breast cancer cells, and PANC1 pancreatic cells by partial silencing of CD47.
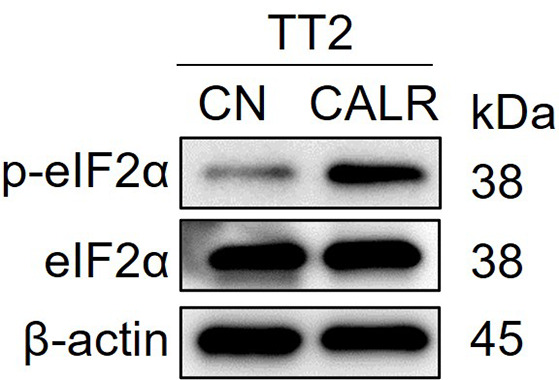
Figure 5—figure supplement 5. Elevation of the phosphorylation of eukaryotic translation initiation factor 2 alpha (p-eIF2a) in TT2 osteosarcoma (OS) cells by the application of calreticulin (CALR).
