. 2023 Feb 17;12:e75825. doi: 10.7554/eLife.75825

Figure 2. Total iron quantification in tissues.

Quantification of total iron by ICP-MS from WT and Ndufs4−/ mice at PND35 fed control (40 ppm) or low (8 ppm) AIN-93G in (A) liver, (B) whole brain, (C) kidney, (D) heart, (E) quadricep, (F) spleen, and (G) duodenum. N=3–5 mice. *p<0.05, **p<0.01, ***p<0.001, ANOVA with post hoc Tukey. ICP-MS, inductively coupled plasma mass spectrometry; WT, wild-type.

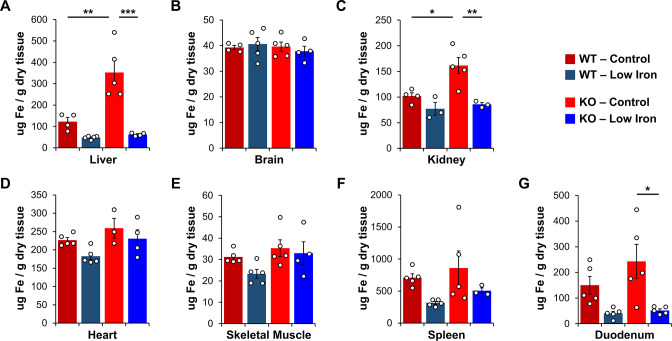
Figure 2.

Figure 2—figure supplement 1. Analysis of biologically-relevant transition metals.

Figure 2—figure supplement 1.

(A) Left, Box, and whisker plot of combined z-score-normalized ICP-MS values of tissue iron, (B) manganese, (C) zinc, and (D) copper in WT and Ndufs4−/ mice on control (40 ppm) or low (8 ppm) AIN-93 diet (each point represents z-score value for an individual tissue). (A–D) Right, heat map of individualized z-scores by tissue. N=3–5 mice. *p<0.05, ***p<0.001, ****p<0.0001, t test with Bonferroni correction. ICP-MS, inductively coupled plasma mass spectrometry; WT, wild-type.
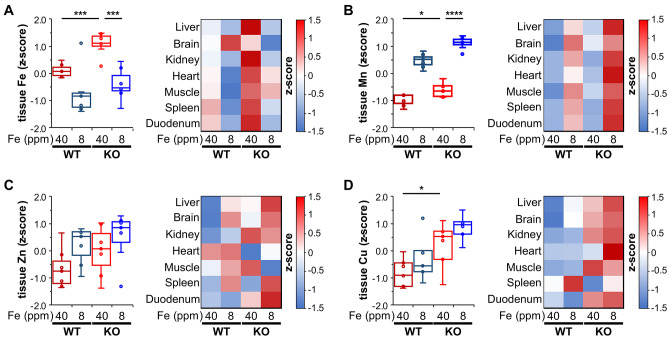
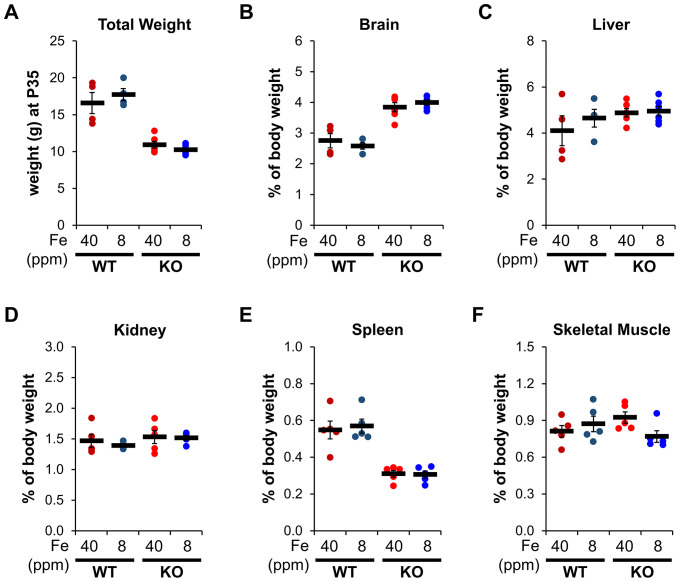
Figure 2—figure supplement 2. Iron restriction has no effect on organ size.

Figure 2—figure supplement 2.

(A) Weight at time of tissue collection (PND35) of WT or Ndufs4−/ mice on a normal (40 ppm) or low (8 ppm) AIN-93G synthetic diet. (B) Percent of tissue weight from mice in (A) relative to total body weight at time of collection (PND35) in brain, (C) liver, (D) kidney, (E) spleen, and (F) quadricep.