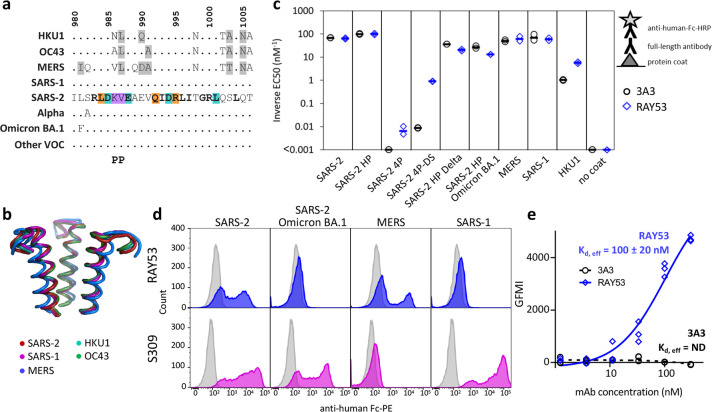
Figure 4. The hinge epitope is conserved across β-coronaviruses and variably accessible in authentic spike.
The hinge epitope recognized by 3A3 (SARS-2 amino acids 980–1006) is highly conserved across the spike (a) sequences and (b) structures of β-coronaviruses known to infect humans, including Alpha, Omicron BA.1, and other variants of concern (VOC; Beta, Gamma, Delta, Epsilon, Omicron BA.2 through BA.5). In (a), identical residues are indicated by a dot and similar residues are highlighted in gray. Residues conserved across all listed β-coronaviruses are in bold. Residues that lost binding to 3A3 when altered as shown in Figure 3 are in teal highlight and those whose disruption improved binding are orange. The location of the two proline mutations introduced to 2P variants are shown below the alignment. In (b), the structure of each epitope is displayed as follows: SARS-2 (6VSB) – red, SARS-1 (6CRV, RMSD = 0.8 Å) – magenta, MERS (5X5C, RMSD = 3.1 Å) – blue, HKU1 (5I08, RMSD = 0.5 Å) – teal, OC43 (6OHW, RMSD = 0.6 Å) – green. (c) Binding of full-length antibody 3A3 (black circles) and RAY53 (blue diamonds) to ancestral SARS-2, SARS-2 HexaPro (SARS-2 HP), SARS-2 4P, SARS-2 4P-DS, SARS-2 HexaPro Delta (SARS-2 HP Delta), SARS-2 HexaPro Omicron BA.1 (SARS-2 HP Omicron BA.1), MERS, SARS-1, HKU1, or milk (no coat) proteins by ELISA. Data are representative of duplicate biological replicates, each with duplicate technical replicates. The data midpoint is indicated with a bar. (d) Plasmids encoding full-length unstabilized spike proteins from SARS-2, SARS-2 Omicron BA.1, MERS, or SARS-1 were transiently transfected to Expi293 cells. The spike (blue or magenta histograms) or mock (grey histograms) transfected cells were stained with 100 nM RAY53 (top panels) or 10 nM control antibody S309 (bottom panels), followed by goat-anti-human Fc-PE secondary antibody, and flow cytometry scanning of 10,000 cells. The data shown are representative of triplicate experiments, with each condition repeated in technical duplicate. (e) Expi293 cells were transiently transfected with plasmids encoding SARS-2 spike and EGFP or EGFP only, then incubated with 3A3 (black circles) or RAY53 (blue diamonds) antibody (~1–300 nM) and anti-human Fc-PE before flow cytometric determination of the geometric mean fluorescence intensity (GMFI) in the PE channel for all green fluorescent cells. The GMFI of cells transfected with EGFP only was subtracted from the GMFI of cells expressing spike at each concentration, and the data fit to a three-parameter logistic curve to determine the effective Kd (Kd,eff) for antibody binding. The data shown are representative of triplicate experiments; ND, not detected.

