. 2023 Mar 21;12:e83710. doi: 10.7554/eLife.83710

Figure 5. Targeting the hinge epitope recruits Fc effector functions.

(a) Neutralization was evaluated by pre-incubating antibody with pseudotyped HIV particles that were then added to HEK 293T cells stably expressing ACE2 (SARS-1 and SARS-2 pseudoviruses) or DPP4 (MERS pseudovirus), with viral entry detected by luciferase luminescence. The entry efficiency of pseudoviruses without any treatment was considered 100%. (b) Neutralization of authentic SARS-2 wild-type virus was assessed by incubating viral particles with antibody before adding to Vero HF cells. Viral infection was assessed by ELISPOT 24 hr after infection by immunostaining with the anti-SARS-2 nucleocapsid antibody 1C7C7. (c) ADCP was performed by co-incubating undifferentiated THP-1 cells, antibodies and pHrodo-Green/APC-polystyrene beads coated with HexaPro or 4P-DS. The phagocytosis score was calculated as the percent of positive APC/FITC cells multiplied by the GMFI for APC. Data were collected from two separate experiments with the average and standard deviation shown. (d) ADCC was assessed by incubating NK-92 V/V cells, HEK-293T cells transfected to express either wild-type SARS-2 spike (spike) or nothing (mock) and antibody. For each panel, data shown are representative of three biological replicates. Duplicate technical replicates with the midpoint of each condition are shown.

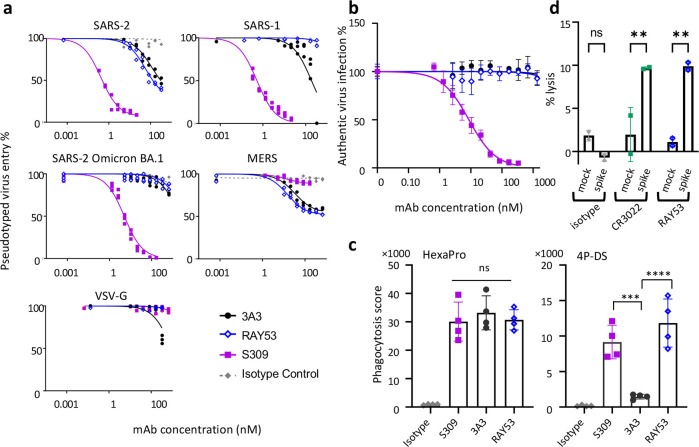
Figure 5—source data 1. Data reporting antibody effect on infection with pseudovirus, authentic virus, phagocytosis score, and cellular lysis.

Figure 5.

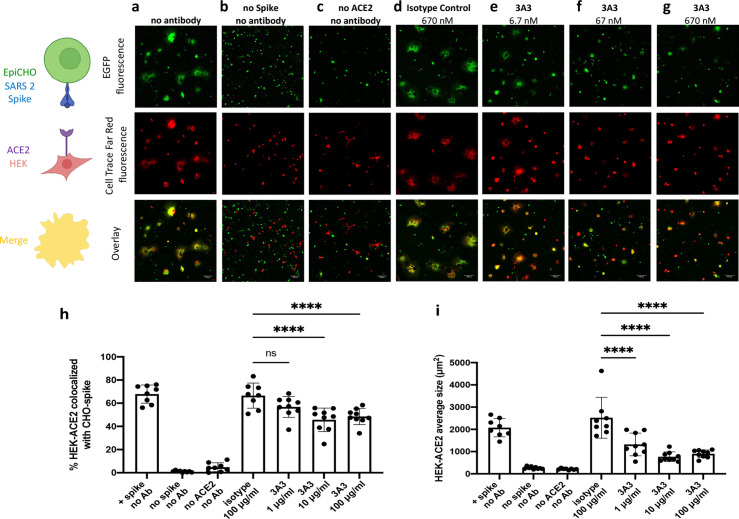
Figure 5—figure supplement 1. Antibody 3A3 inhibits cellular fusion induced by the interaction of SARS-2 spike with human ACE2.

Figure 5—figure supplement 1.

(a) HEK 293 cells stably expressing human ACE2 were stained with Cell Trace Far Red and incubated with a CHO-based cell line transiently expressing authentic SARS-2 spike and EGFP. The cultures were imaged after 24 hr of incubation for EGFP (green) or Cell Trace Far Red (red) and the level of colocalization (yellow) was evaluated. (b) CHO cells not expressing SARS-2 spike and (c) HEK 293 cells not expressing ACE2 exhibited minimal fusion. (d) When the cultures were preincubated with an irrelevant isotype control antibody, extensive fusion and syncytia formation equivalent to no antibody was apparent. Incubation at (e) 6.7, (f) 67, and (g) 670 nM 3A3 reduced fusion in a dose-dependent manner with significance reached at 67 nM. Scale bar, 100 μm. (h) The percentage of HEK-ACE2 pixels (red) colocalizing with spike expressing CHO pixels (green) was analyzed with the JACoP plugin for ImageJ. (i) The same images were analyzed for the average cell size of fused HEK-ACE2 with ImageJ as a second statistical method to test the cell fusion level. Shown are the mean and standard deviation of at least 160 cells per condition from 8 to 9 independent images. The statistical analysis of average cell sizes under different conditions were performed with ANOVA followed by Tukey’s HSD test. Results shown are representative of four independent experiments; ****p<0.0001.