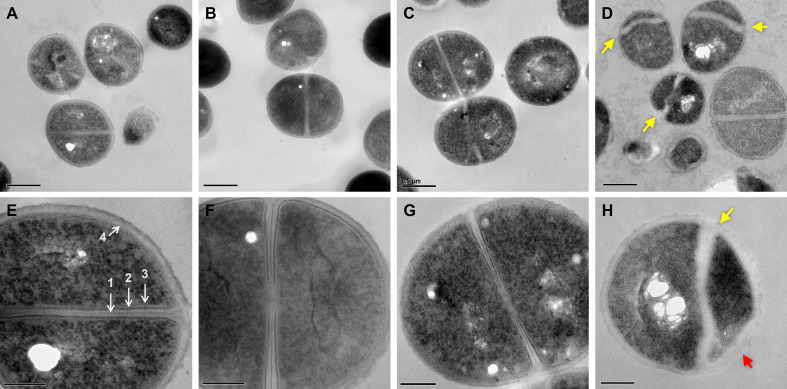
Figure 6. Dual treated cells display septal aberrations.
The ultrastructure of S. aureus cells treated for 30 min was visualized by TEM. (A–H)S. aureus HG003 grown to mid-exponential phase was treated with DMSO (A and E), 11 μg/ml PA (B and F), 20 μg/ml VAN, (C and G) and PA +VAN (D, H). (A–C and E–G) Micrographs of cells with a cross wall at mid-cell, while (D and H) show cells treated with PA +VAN have deformed septa (yellow arrows) and membrane invaginations (red arrows). Magnification of 50,000× with a 0.5 μm scale bar (A–D) or magnification of 150,000× with a 200 nm scale bar (E–H). (E) (1) Electron-dense midline of the septum, (2) electron-dense intermediate layer, located between the (3) cell membrane and the (4) cell wall. The white holes in the cytoplasm of imaged cells are artifacts that occur during sample preparation (Tizro et al., 1897). PA, palmitoleic acid; VAN, vancomycin.
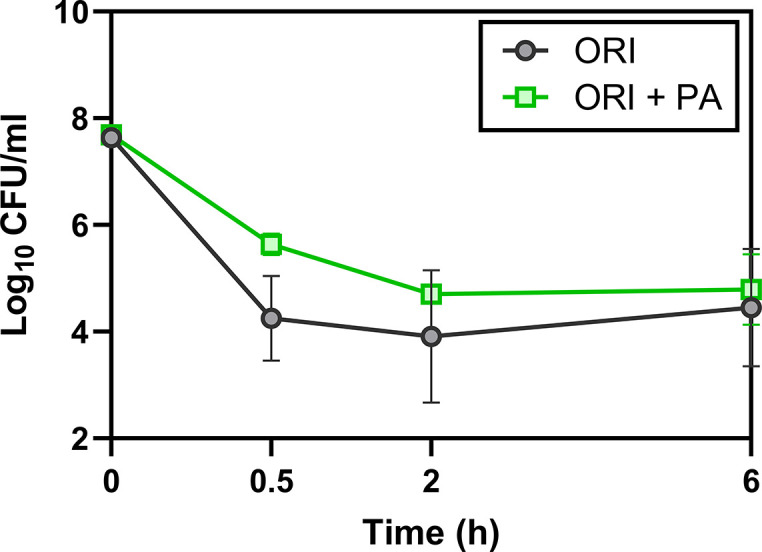
Figure 6—figure supplement 1. Lipoglycopeptides do not synergize with palmitoleic acid.


