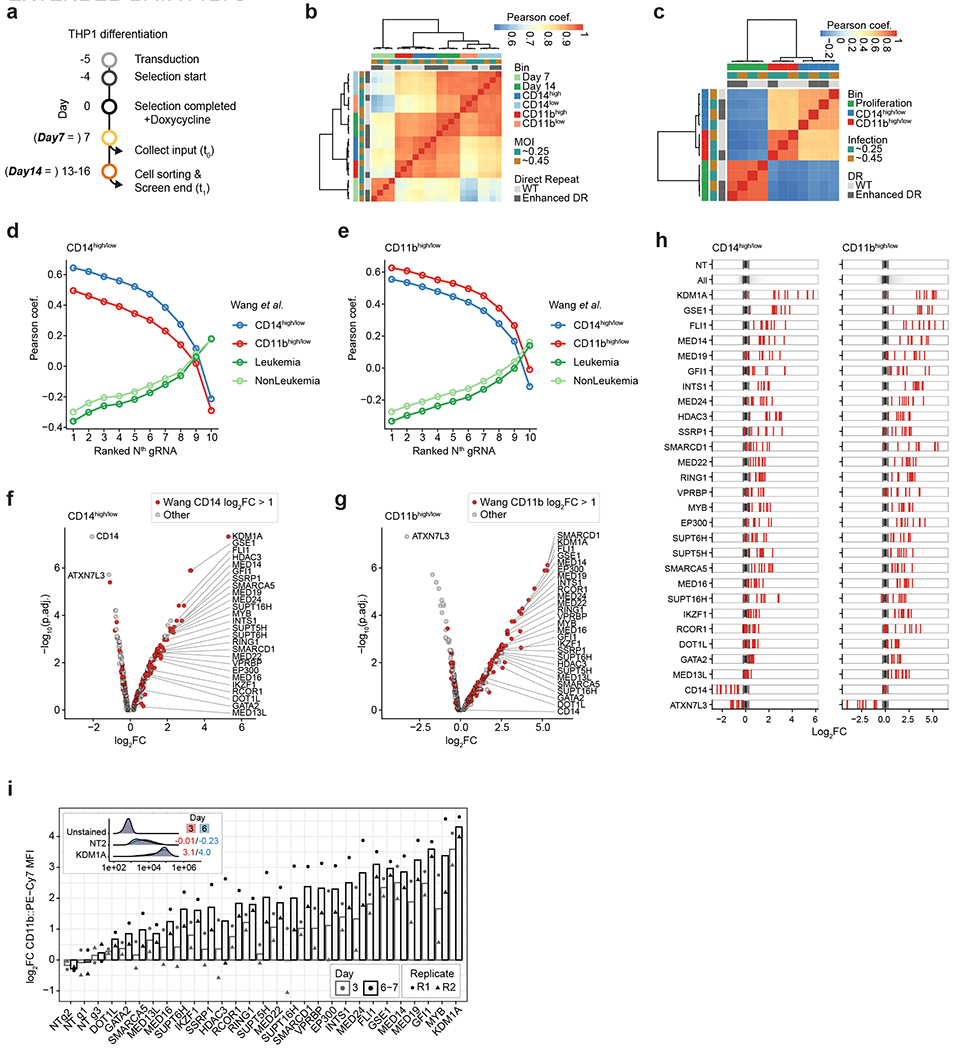
Extended Data Fig. 6 |. A pooled Cas13 screen identifies regulators of AML differentiation.

a) Timeline for THP1 cell infections and pooled screen readouts for CD14 and CD11b fluorescent activated cell sorting (FACS). We transduced a pooled lentivirus library with 4,800 gRNAs targeting 439 genes (10 gRNAs per gene) and 410 NT control gRNAs. Each gRNA was tested using two alternative Cas13d direct repeat (DR) sequences [wildtype (WT) or enhanced DR; see Methods]. Cells were infected at two different MOIs for each DR. Cells were collected at day 7 (timepoint 0; t0) and approximately day 14 (range between day 14 and day 16; t1) post Cas13d induction. On day 14, cells were sorted based on their cell surface protein expression into CD14 and CD11b high (top 15%) and low (bottom 15%) bins. At each time point, we collected and sorted cell populations with >1000x coverage. With alternative MOI infections and DR sequences used, we conducted four and three replicated phenotypic cell sorts for CD14 and CD11b. b) Pearson correlation of normalized and batch corrected gRNA counts for all samples. c) Pearson correlation of log2-transformed gRNA enrichments of the population of interest relative to the corresponding control population (CD11bhigh/low: gRNA counts in CD11bhigh bin divided by CD11blow bin; CD14high/low: gRNA counts in CD14high bin divided by CD14low bin; proliferation: gRNA counts at t1 divided by t0). d) Correlation of log2FC gene enrichments for CD14 upregulation (CD14high/low) to enrichments presented in Wang et al. Correlation analysis was repeated for every single ranked gRNA (see Methods), always considering only one ranked gRNA per target gene. This analysis indicated that, as expected, target gene enrichments for CD14 upregulation correlated best with CD14 target gene enrichments in Wang et al., and that correlations were similarly high for the top-ranked 4-5 gRNA. e) Similar analysis as presented in d showing result for target genes regulating CD11b enrichments. f) Volcano plot showing gene enrichments for target genes regulating CD14 upregulation (CD14high/low). Each gene is represented as the mean of the four top-ranked gRNAs across all replicate experiments (see Methods). Y-axis shows −log10 transformed adjusted p-value derived from Robust Ranked Aggregation (RRA). Target genes selected based on previous results (Wang et al.) are shown in red. The 28 genes used in the subsequent CaRPool-seq experiment are highlighted. As expected, CD14 was the most depleted gene. g) Similar analysis as presented in (f) showing results for target genes that lead to CD11b enrichment. CD11b-targeting gRNAs were not included in the gRNA library. h) Consistent gRNA enrichment/depletion of all 28 target genes. (NT = all non-targeting gRNAs, All = all gRNAs, Gene Name = Red ticks highlighting targeting specific gRNAs atop of the non-targeting gRNA distribution (n = 10 per target gene). Dotted lines indicate the 95 percent confidence interval for NT gRNA distribution). i) CD11b expression upon individual gRNA infections for 26 hit genes and three NT controls. Cas13d expressing THP1 cells were transduced with individual gRNA-delivering lentivirus targeting one out of 26 selected target genes (gRNA was selected from pooled screen). Cells were assayed repeatedly (three and six-to-seven days post Cas13d-induction with doxycycline) for CD11b levels. Y-axis shows the CD11b::PE-Cy7 MFI relative to the average of all three NT control samples for the respective time point. Bars show the mean of two independent replicates (two THP1 Cas13d cell thaws infected on separate days). The inset shows CD11b::PE-Cy7 levels in KDM1A and NT targeted cells three and six days after Cas13d induction.
