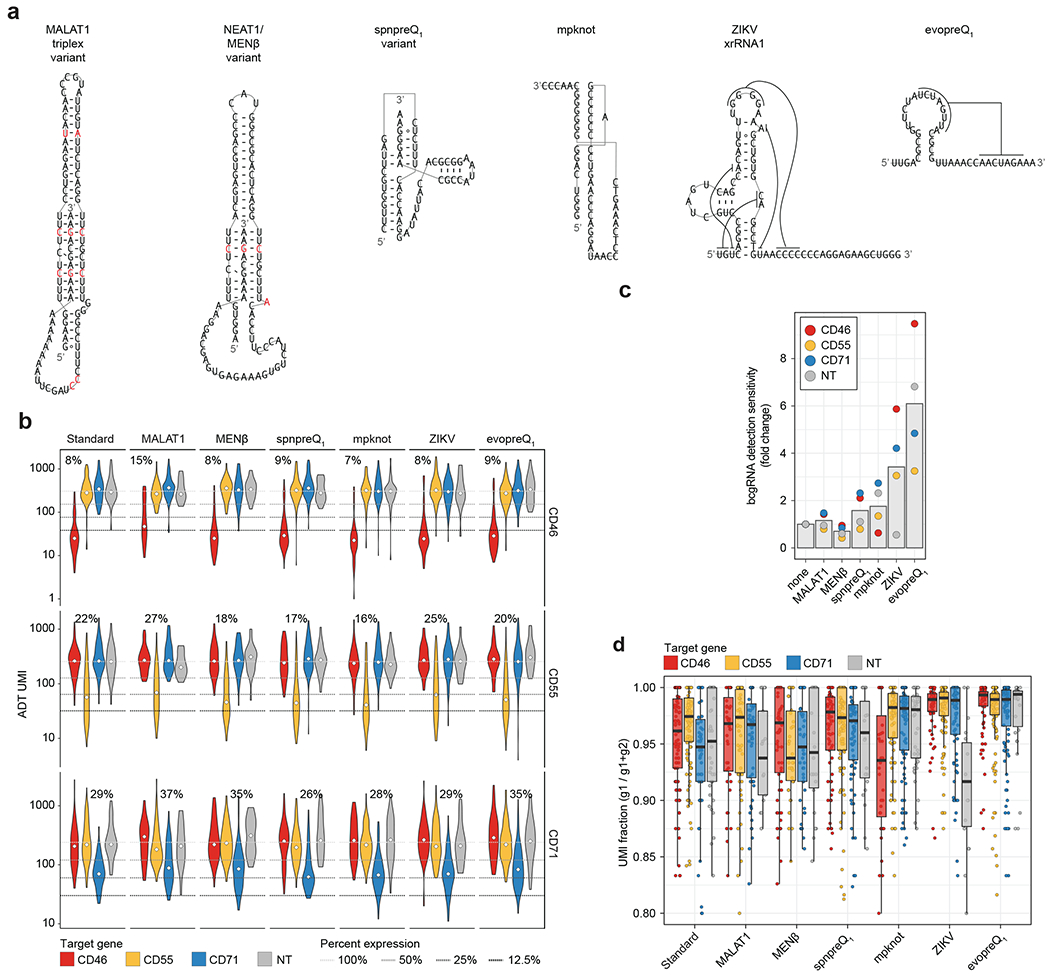
Extended Data Fig. 9 |. Structured RNAs can improve bcgRNA detection in CaRPool-seq experiments.

a) Nucleotide sequences that can form stable RNA structures when placed 3′ to a bcgRNA. Sequences found in MALAT1 and NEAT1 (MENß) required nucleotide exchanges (shown in red) to remove potential terminator sequences (≥ 4U) and allow the sequences to be fully transcribed by RNA polymerase III. b) Violin plots depicting protein expression of target genes (ADT UMI counts for CD46, CD55, CD71), grouped by CRISPR arrays [combination of target gene (y-axis) and stabilizing RNA element (x-axis); (total cells: n = 1,770; conditions n = 28; cell per condition: median n = 63 cells; s.d. n = 30 cells)]. Three dashed lines indicate 50%, 25%, and 12.5% UMI count relative to the mean of all non-targeting cells by target ADT. The numbers above each violin plot indicate the median reduction across single cells for cells with matching gRNA and target. Diamonds indicate median value of cell population. c) Fold enrichment of bcgRNA UMI counts relative to UMI counts in the standard bcgRNA capture condition separated by the target gene. The evopreQ1 element yielded on average 6-fold higher bcgRNA detection sensitivity (n = 4 per condition). Bars indicate mean. d) UMI Fraction comparing the assigned bcgRNA to the sum of assigned and second most abundant bcgRNA that may be detected for the same cell [UMI g1 / (UMI g1 + UMI g2)]. Boxes indicate the median and interquartile ranges, with whiskers indicating 1.5 times the interquartile range. (Total cells: n = 1,770; conditions n = 28; cell per condition: median n = 63 cells; s.d. n = 30 cells).
