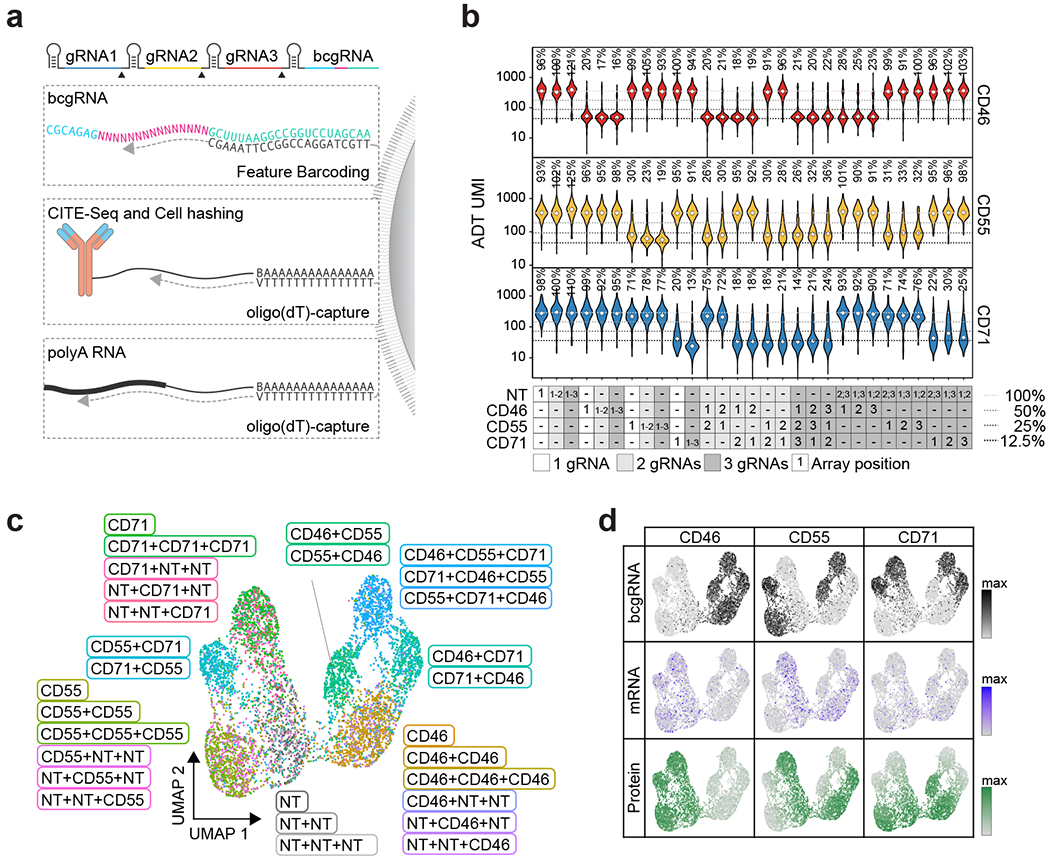
Fig. 2 |. CaRPool-seq enables combinatorial gene targeting with a multimodal single-cell readout.

a, CaRPool-seq can be combined with CITE-seq and Cell Hashing modalities. b, Violin plots depicting protein expression of target genes (ADT UMI counts for CD46, CD55, CD71), grouped by CRISPR arrays (n = 29; median number of cells 269; s.d. 97 cells). Three dashed lines indicate 50, 25 and 12.5% UMI count relative to the median of all NT cells. Diamonds indicate the median UMI count. The number above each violin plot indicates the mean level of reduction across single cells. CD71 + CD71 was not included in the experiment. c, UMAP visualization of single-cell protein expression profiles of CaRPool-seq experiment (n = 6,986 cells). Cells are colored based on the single or combinatorial perturbations they received. d, Expression levels of bcgRNA (black), mRNA (blue) and protein (ADT, green) for CD46, CD55, CD71 superimposed on the UMAP visualization (n = 6,986 total cells).
