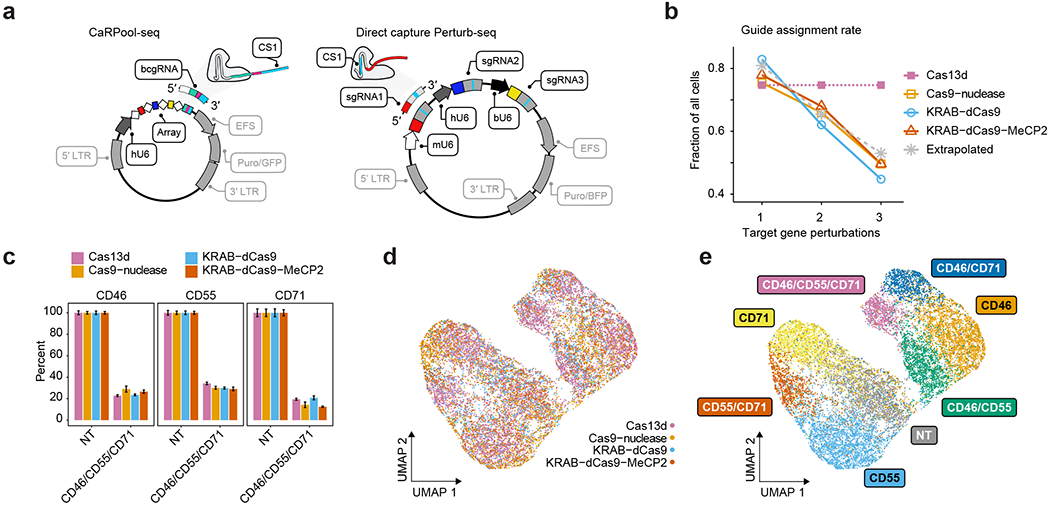
Fig. 3 |. Benchmarking CaRPool-seq against alternative combinatorial perturbation approaches.

a, Plasmid vectors for lentivirus production for triple perturbation scenarios comparing CaRPool-seq and Direct Capture Perturb-seq6. b, Fraction of cells where the correct combination of gRNA was detected for single, double and triple perturbations. The dashed gray line represents a theoretical extrapolation based on an assumption of independent sgRNA detection with P = 0.81 (ref. 6). c, Relative expression of cell surface proteins CD46, CD55 and CD71 in cells with assigned NT (s)gRNAs or a combination of three targeting (s)gRNAs (NT, n = 448, 711, 510, 577; CD46/CD55/CD71, n = 874, 55, 142, 89 for Cas13d, Cas9-nuclease, KRAB–dCas9 and KRAB–dCas9–MeCP2, respectively). The expression level of each target is normalized to NT control. Bars indicate mean across cells with s.e.m. error bars. d, Protein level ADT-based clustering of single-cell expression profiles of merged CaRPool-seq (n = 6,986), Perturb-seq experiments using Cas9 (n = 2,836), KRAB–dCas9 (n = 2,911) or KRAB–dCas9–MeCP2 (n = 3,038). Cells are colored by perturbation technology. e, As for d. Cells are colored based on the single or combinatorial perturbation received.
