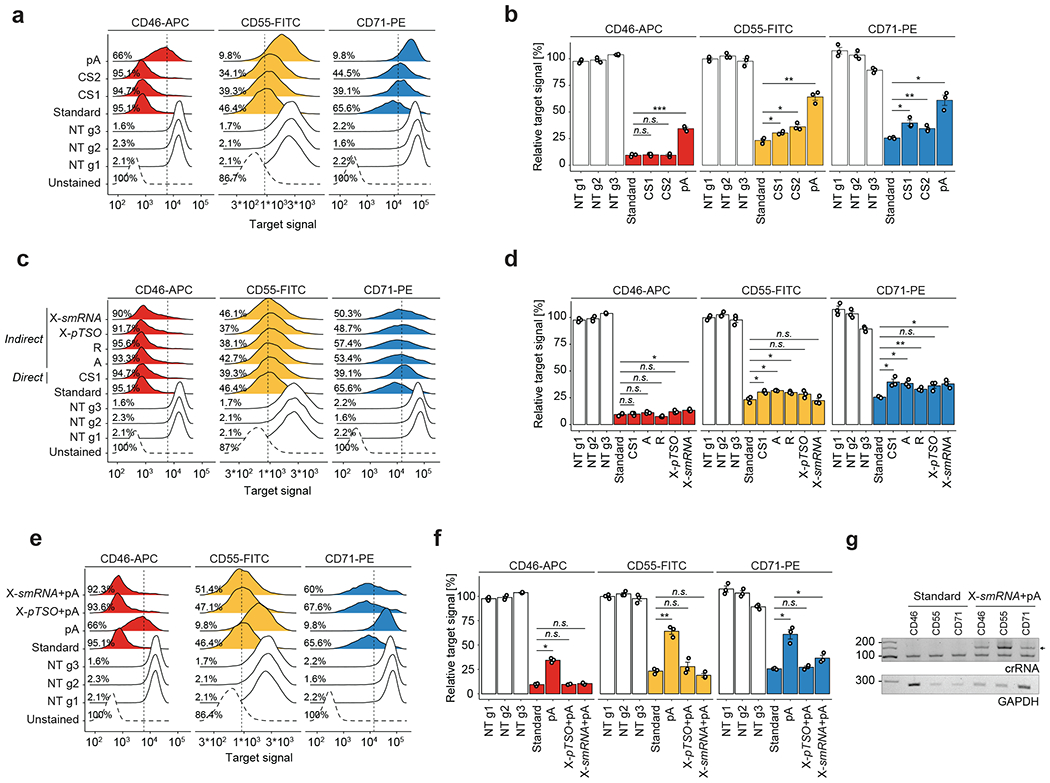
Extended Data Fig. 1 |. Direct and indirect Cas13 guide RNA capture allow for robust target knockdown.

a) Density plots showing the CD46-APC, CD55-FITC and CD71-PE flow cytometry signal upon Cas13d-mediated knockdown with either regular gRNAs or a direct capture gRNA with one of three reverse transcription handles (pA(30) = polyA-tail of length 30, CS1 = 10x Genomics Capture Sequence 1, CS2 = 10x Genomics Capture Sequence 2, NT = non-targeting). Vertical lines mark the threshold for CD-protein negative cells (2nd percentile of NT cell populations), indicating the percent negative cells for one replicate experiment. Importantly, the Cas13-mediated function shows a unimodal response, suggesting limited cell-to-cell differences in target gene knockdown. N > 5000 cells examined per sample. Shown is one representative replicate. b) Summary analysis of biological replicate experiments (n = 3) as shown in (a). Y-axis shows the mean fluorescent intensity (MFI) relative to the average of all NT cell populations. Direct capture constructs with CS1 or CS2 enable strong knockdown for CD46, but reduced knockdown for CD55 and CD71. Direct capture with pA-handle shows strongly reduced knockdown efficiency compared to regular gRNAs (standard condition). Two-sided t-test with * p < 0.05, ** p < 0.01, and *** p < 0.001. Error bars depict SEM. c) Density plots showing the CD46-APC, CD55-FITC, and CD71-PE signal upon Cas13d-mediated knockdown with either regular gRNAs, a direct capture gRNA, or indirect capture construct of types A, R, and X as shown in Fig. 1a. CS1 was used in all constructs with RT-handle. Type X was used with either a partial TSO (pTSO) PCR priming site or an Illumina smallRNA PCR-handle sequence. Vertical lines mark the threshold for CD-protein negative cells, indicating the percent negative cells for one replicate experiment. N > 5000 cells examined per sample. Shown is one representative replicate. d) Summary analysis of biological replicate experiments (n = 3) as shown in (c). Y-axis shows the mean fluorescent intensity (MFI) relative to the average of all NT cell populations. Indirect capture constructs show strong target gene knockdown similar to regular gRNAs (standard condition) for all three target genes. The slight reduction in targeting efficiency in indirect guide capture may be explained by CRISPR array processing constraints. Two-sided t-test with * p < 0.05, ** p < 0.01, and *** p < 0.001. Error bars depict SEM. e) Density plots showing the CD46-APC, CD55-FITC, and CD71-PE signal upon Cas13d-mediated knockdown with either regular gRNAs, a direct capture gRNA, or indirect capture construct of type X. Here, comparing the effect and placement of a polyA-tail RT-handle. pA indicates direct capture construct with polyA-tail. Type X was used with either a pTSO or smallRNA PCR-handle sequence. Vertical lines mark the threshold for CD-protein negative cells, indicating the percent negative cells for one replicate experiment. N > 5000 cells examined per sample. Shown is one representative replicate. f) Summary analysis of biological replicate experiments (n = 3) as shown in (e). Y-axis shows the mean fluorescent intensity (MFI) relative to the average of all NT cell populations. Indirect capture constructs show strong target gene knockdown like regular gRNAs (standard condition) for all three target genes. Target knockdown with direct capture through a polyA-tail sequence is limited. Two-sided t-test with * p < 0.05, ** p < 0.01, and *** p < 0.001. Error bars depict SEM. g) PCR amplicons of reverse-transcribed crRNAs from lentivirally infected cells used in (e) showing one representative experiment. Indirect capture of Type-X crRNAs with smallRNA PCR-handle and polyA-tail (arrow) allowed for reverse transcription and amplification. These results show that indirect gRNA capture can be facilitated with polyA-tail capture as an alternative to CS1-based capture.
