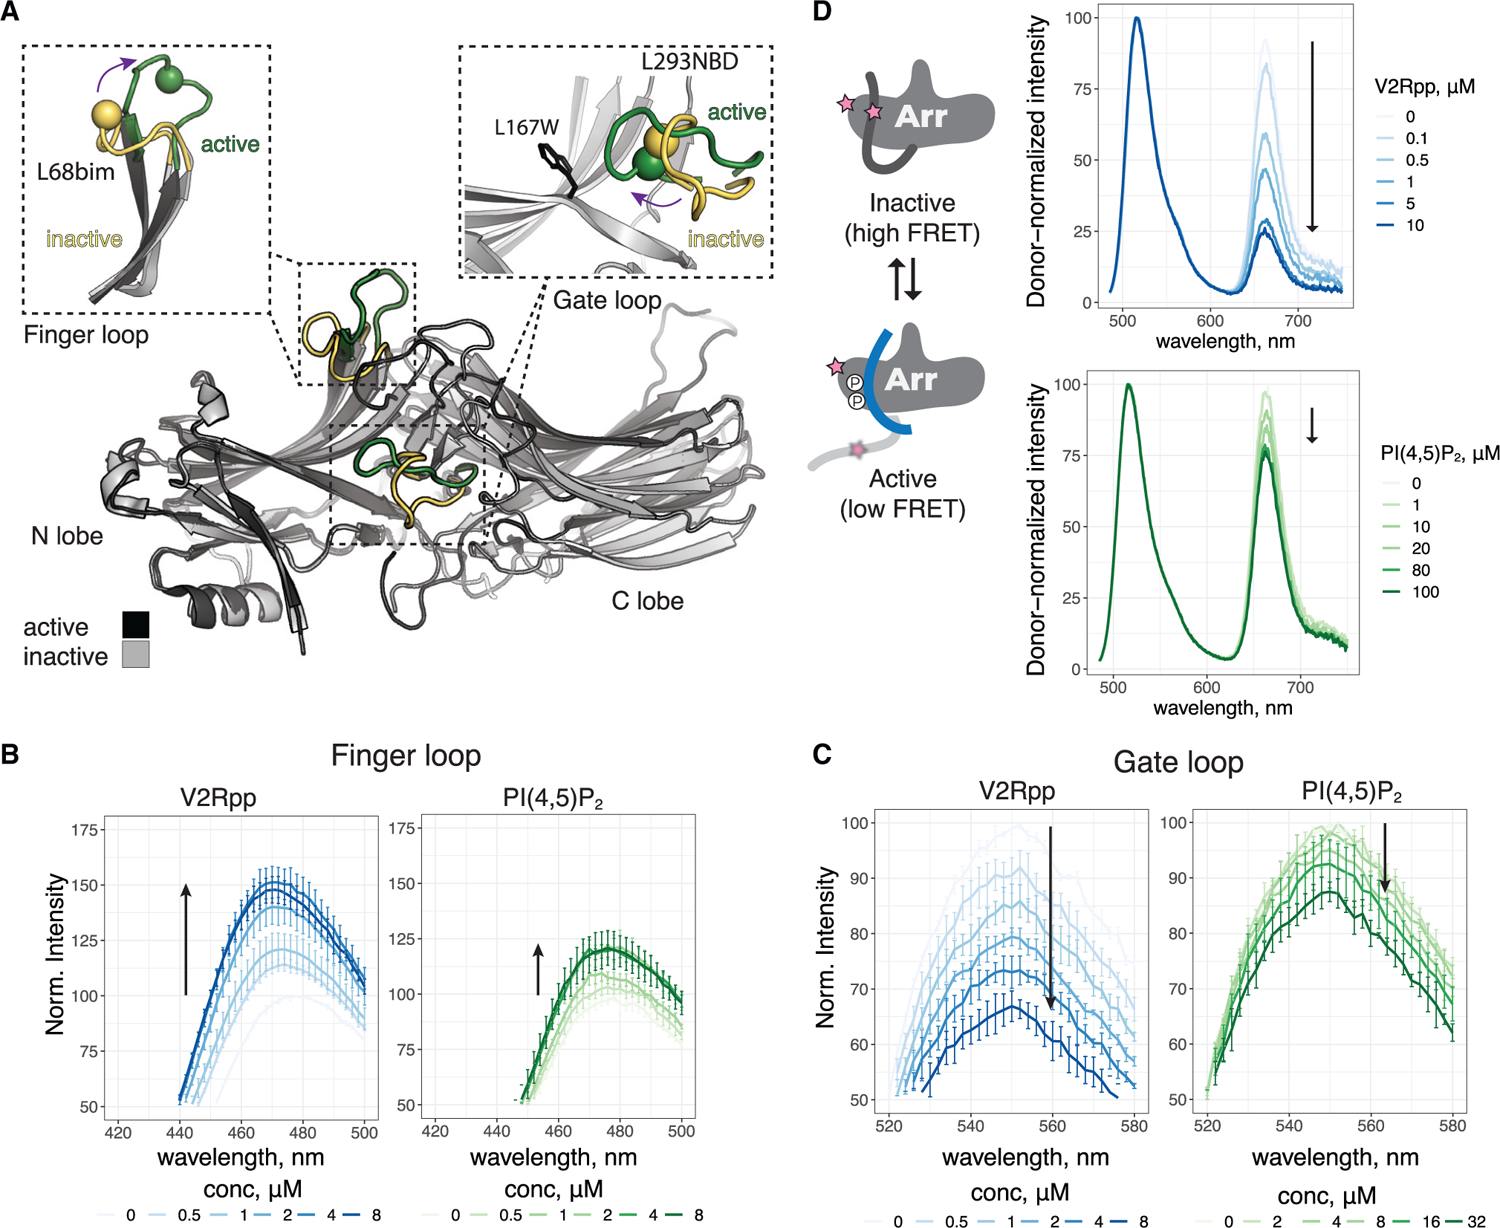
Figure 5. PIP2 alone promotes conformational changes in βarr1.

(A) Overlay of inactive (PDB: 1G4M) and active (PDB: 4JQI) βarr1. The N and C lobes of βarr1 are indicated. Activation leads to reorganization of several loops; the gate and finger loops are highlighted. Re-orientation of these loops from inactive (yellow) to active (green) is monitored by site-specific fluorescence spectroscopy. In finger loop inset, the sphere denotes Cα L68C, which is labeled with bim. In gate loop inset, the sphere denotes Cα L293C, which is labeled with NBD. The installed W residue replacing L167 that quenches 293NBD is shown.
(B) Spectra of L68bim-labeled βarr1 in response to V2Rpp and PIP2.
(C) Spectra of L167W-L293NBD-labeled βarr1 in response to V2Rpp and PIP2.
(D) Left, cartoon showing how FRET change is linked to C-terminal release. Right, spectra of AF488/AT647N-labeled βarr1 in response to V2Rpp and PIP2. In (B)–(D), arrows indicate direction of change with increasing concentration. In (B) and (C), values are mean ± SEM (n = 3), and spectra were normalized to apo for each experiment. In (D), spectra are normalized by donor intensity within a given experiment, and data are shown for a representative experiment (n = 2–4).
