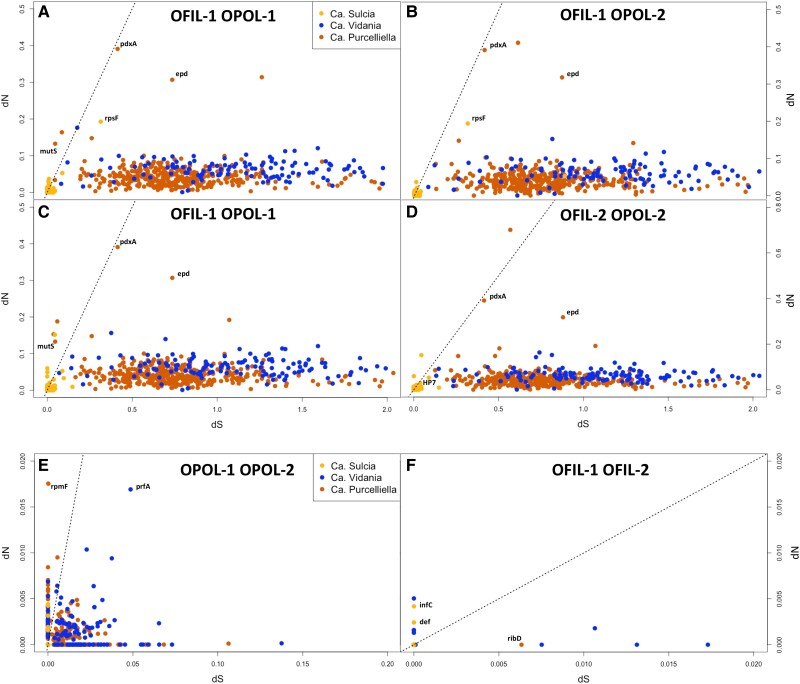
Fig. 4.
(A)–(D) Pairwise intraspecific comparisons of symbiont orthologs showing rates of synonymous (dS) and nonsynonymous (dN) substitutions between host species. Points represent individual orthologous genes from each symbiont comparison. The dashed line represents the point at which dN = dS, or ω = 1. Genes below the line are considered to be under purifying selection (dS > dN), and genes above the line are considered to be under positive selection (dN > dS). (E) and (F) Pairwise interspecific comparisons of symbiont orthologs.

