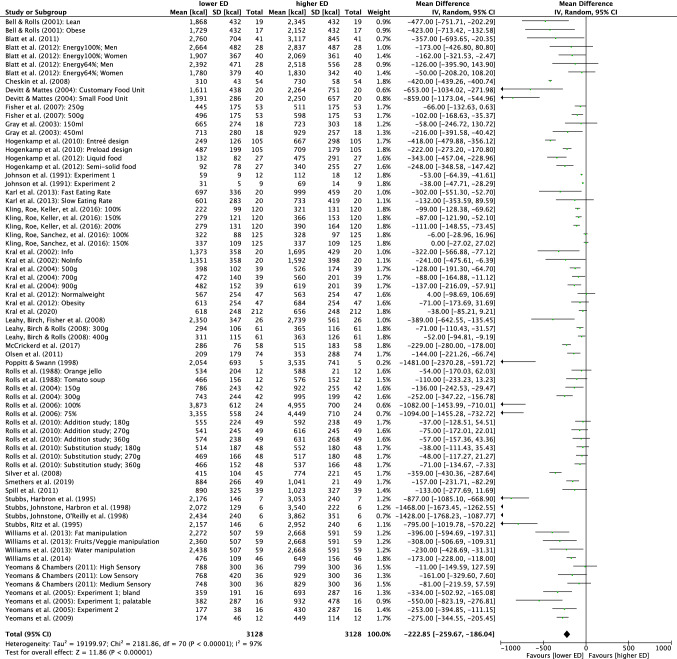
Fig. 3.
Quantitative analysis of energy intake of all randomized controlled trials receiving either lower energy density (ED) or higher ED meals. The forest plot displays effect estimates and 95% confidence intervals (CI) for individual studies and the summary of findings. Additionally, for each study mean energy intake [kcal], standard deviation (SD) [kcal] and the number of total participants of both lower ED and higher ED conditions are presented. IV inverse-variance

