
Fig. 2.
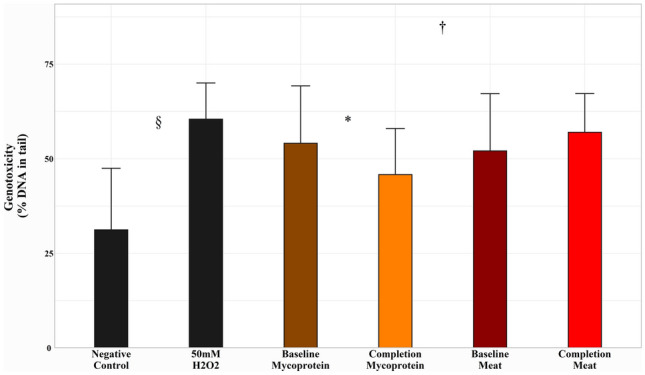
Effects of Meat and Mycoprotein phases on faecal genotoxicity, assessed by percentage (%) DNA in tail following exposure to faecal water. Data represent a mean of four wells per treatment. 50 uM H2O2 and a carrier control were included as inter-assay controls, and t tests revealed a significant difference between 50 uM H2O2 and carrier control (P = 0.02). Mycoprotein phase: change from baseline, − 8.28 ± 3.60%, P = 0.05. Meat phase: change from baseline, + 4.91 ± 2.65%, P = 0.09; Difference in study phase effects, 13.19 ± 4.41%, P = 0.01. Error bars represent standard deviation. Changes within study phases and differences between study phases assessed using mixed-effects models (P ˂0.05 considered significant). *Indicates significant difference from baseline within the Mycoprotein study phase. #Indicates significant difference from baseline within the Meat study phase. †Indicates significant difference between the Mycoprotein and Meat study phase effects. §Indicates significant difference between 50 uM H2O2 and carrier control