
Fig. 7.
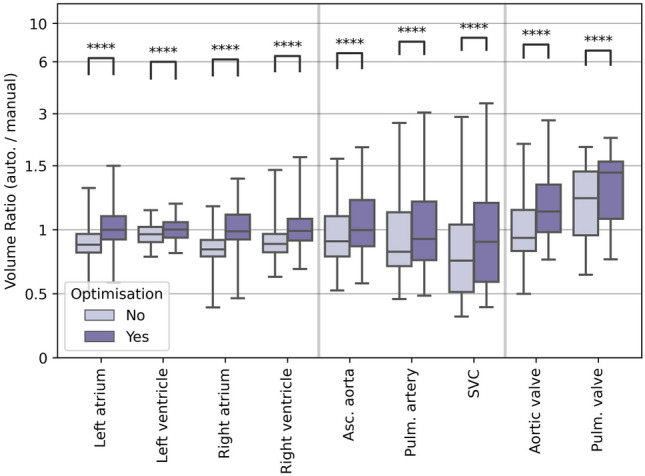
Comparison of volume ratio with and without using the probability threshold optimisation method described in Finnegan et al. [21]. The volume ratio was compared with and without using this optimisation, using the Wilcoxon signed-rank test. This optimisation process was not applied to the heart valves, but as their definition depends on structures to which optimisation was applied they are included here. The boxes represent the first and third quartiles, the middle bars represent the medians, and the whiskers represent the range excluding any outliers which are defined as any points greater than 1.5 the inter-quartile range above or below the first or third quartile, respectively (outliers are shown as empty circles). Legend: **** = , Wilcoxon signed-rank test