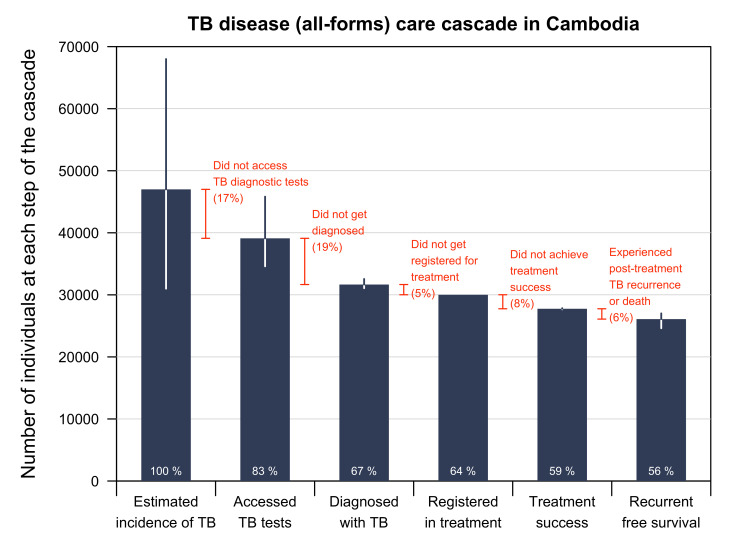
Figure 3.
TB disease care cascade in Cambodia. Proportions (in white) refer to the percentage of people at each step of the cascade compared with the first step (estimated TB incidence). Proportions (in orange) refer to the percentage attritted at each step compared with the previous step (% difference). The treatment success rate presented in the care cascade differs from PPA despite representing 2019’s outcomes because of the denominator used. We used the preceding step to treatment outcome in the care cascade as the denominator resulting in a treatment success rate of 92%. We obtained the treatment success rate in patient pathway analysis (96%) from the WHO database, and it was based on the total number of persons evaluated in 2020 as the denominator. TB, tuberculosis.

