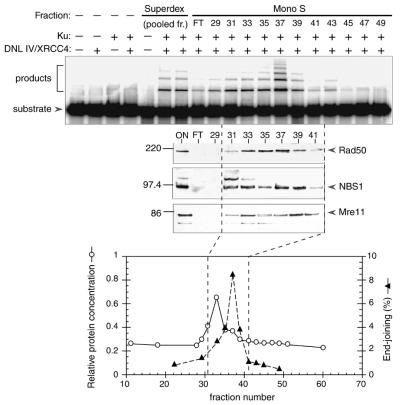
Figure 3.
Characterization of Mono S fractions. Mono S elution profile. Upper panel: end-joining assays were performed as in Figure 2, and contained 2 µl of material from the Superdex 200 column (pooled fractions 25–28) or 3 µl from the Mono S column (flow-through, FT, or undialyzed individual fractions, as indicated). Reactions were performed in the presence or absence of DNL IV/XRCC4 complex (100 ng) and Ku heterodimer (25 ng) as indicated. Middle panels: immunoblotting was performed using the same fractions as in the upper panel, except that 20 µl of the Superdex fraction and 25 µl of the Mono S fractions were used. Three similar blots were probed with rabbit polyclonal sera directed against mouse Rad50, human NBS1 or human Mre11 (Novus Biologicals). The expected position of each protein is indicated by an arrow on the right. Migration of molecular weight markers is indicated on the left. Bottom panel: column profile showing relative protein concentration (determined by the Bradford assay) and end-joining activity in each fraction. Dashed lines indicate the approximate boundaries of the end-joining activity peak.

