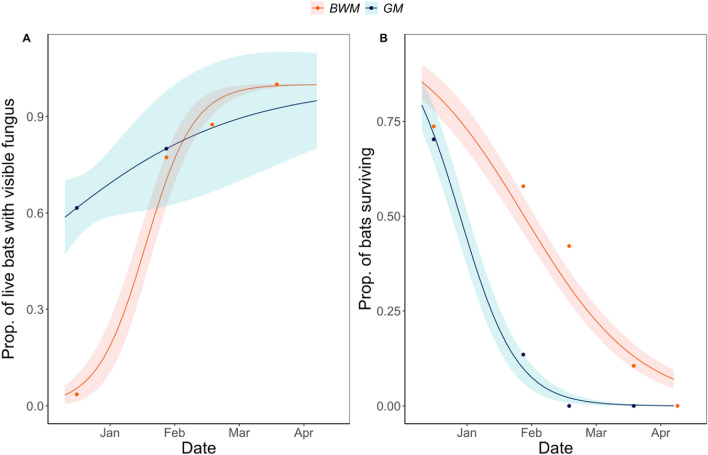
Figure 1.
Visible infection and mortality data from the 2009 translocation experiment. (A) The proportion of live bats with visible fungal growth indicative of P. destructans infection. (B) The proportion of live bats remaining at each site. Sites differed significantly in their dynamics (logistic regression of site interacting with date, visible fungus site*date coef ± SE of GM compared to BWM = − 2.02 ± 1.03, P = 0.05, proportion alive at GM compared to BWM: − 1.15 ± 0.41, P = 0.00546).

