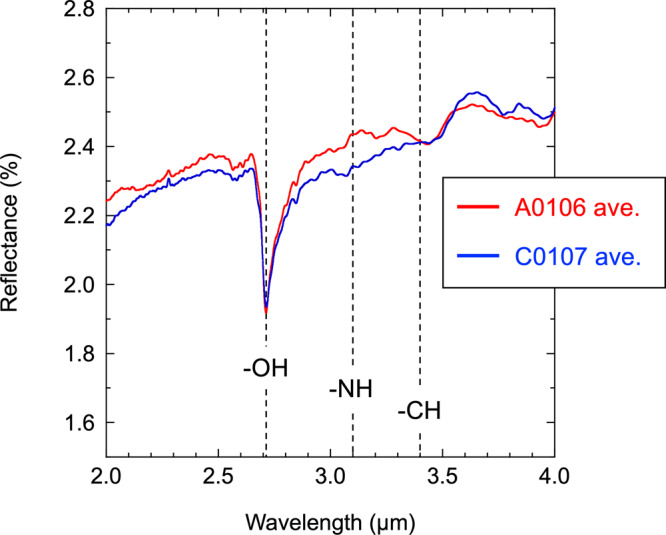
Fig. 3. Infrared spectra of the Ryugu samples.

The raw profiles of infrared reflectance spectra for Ryugu initial bulk samples (A0106 and C0107) within 2.0–4.0 μm. The data acquisition of this non-destructive analysis is described in the literature2. Signals for important functional groups (OH, NH, CH) are indicated in each band by dotted lines. The data management policy is declared in the “Data availability” section of this report.
