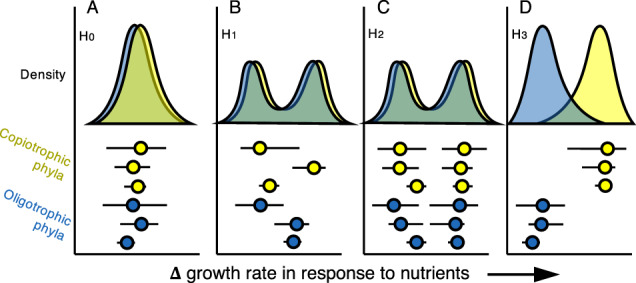
Fig. 1. Hypothesized patterns of nutrient response across microbial lineages and associated life history strategy distributions.

Points at the bottom represent a measure of centrality of nutrient responses across taxa within a phylum while lines represent a measure of spread. Phylum-specific responses are summarized by an expected density distribution of each life history strategy above. Note that the heights of density distributions for each strategy were made equal only for visibility. Panels show nutrient response under different hypotheses. A H0 a continuum of responses exists across all phyla. B H1 bimodality across the community will occur regardless of life history strategy due to differences across phyla (i.e., phyla-level classifications are inaccurate). C H2 bimodality across the community will occur regardless of life history strategy due to differences across taxa within each phylum (i.e., phyla-level classifications are imprecise). D H3 that phyla show clear tendencies for one strategy or another.
