Figure 3.
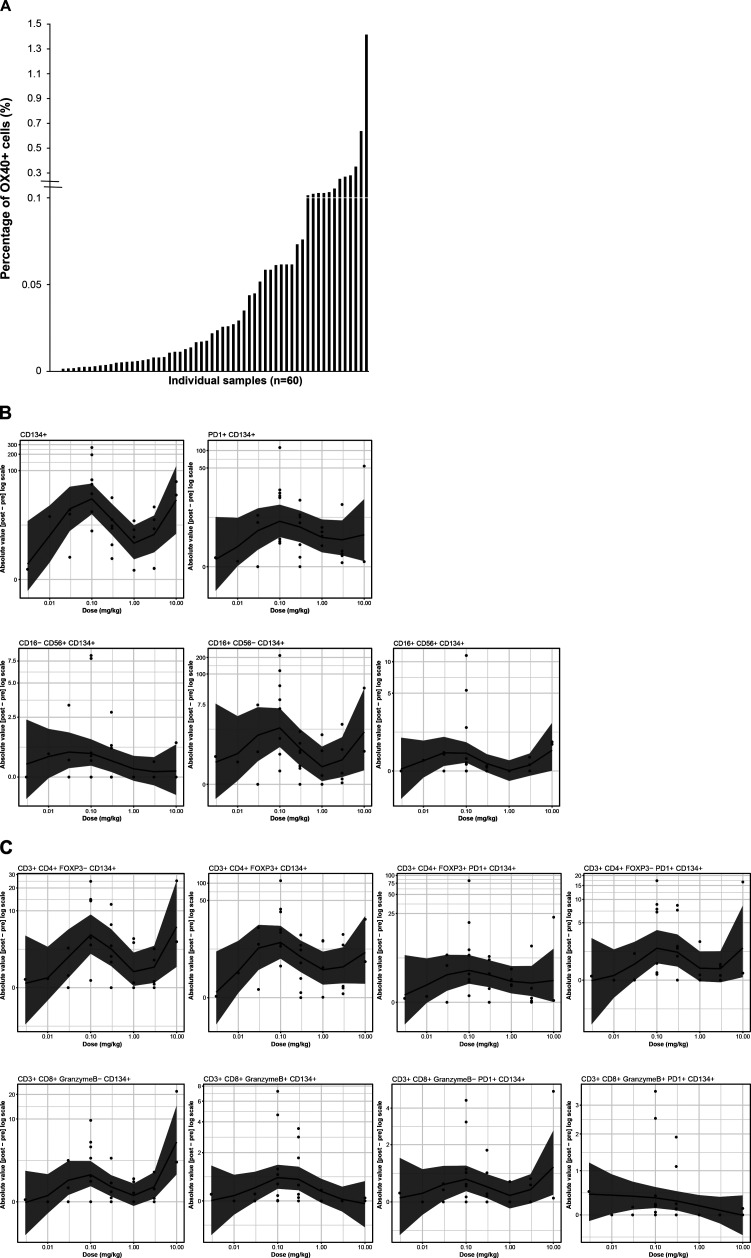
Multiplexed immunofluorescence analysis of OX40 expression. (A) OX40 expression in baseline tumor biopsies (fresh and archival samples). Baseline tumor expression of OX40 is low (0% to 1.4% across all tested samples). (B) Dose dependence of fold changes in OX40+ cell subsets from baseline to on-treatment (week 6) paired fresh tumor biopsies. From left to right: Row 1: CD134+, PD-1+CD134+; Row 2: CD16−CD56+CD134+, CD16+CD56−CD134+, CD16+CD56+CD134+; Row 3: CD3+CD4+ FOXP3−CD134+, CD3+CD4+FOXP3+CD134+, CD3+CD4+FOXP3+PD-1+CD134+, CD3+CD4+FOXP3−PD-1+CD134+; Row 4: CD3+CD8+granzyme B−CD134+, CD3+CD8+granzymeB+CD134+, CD3+CD8+granzymeB−PD-1+CD134+, CD3+CD8+granzymeB+PD-1+CD134+. CD, cluster of differentiation; FOXP3, forkhead box protein 3; PD-1, programmed cell death 1 protein.

