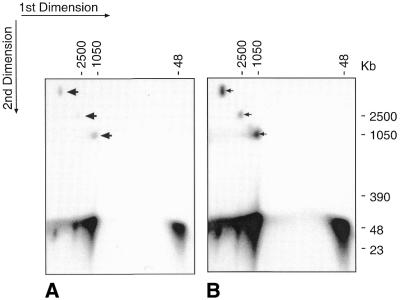
Figure 3.
2D PFGE analysis. (A) A track cut from a PFGE gel of a sample that had been exposed to 100 Krad of γ-rays was treated with a further 100 Krad, before being subjected to PFGE in a 90° orientation. Arrows show residual portions of bands 1–3. (B) Longer photographic exposure of same gel, showing lack of intermediate forms between bands 1–3 and the linear radiation products.

