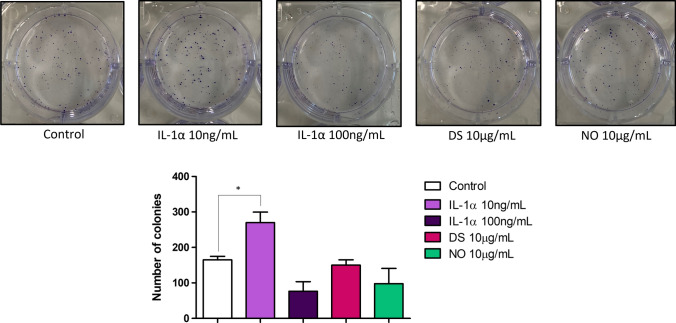
Fig. 9.
Effect of IL-1α and the different redox states of HMGB1 on clonogenic potential of HT-29 cells. Cells were stimulated for 10 days with IL-1α, DS and NO HMGB1. The number of colonies of HT-29 cells was captured at the end of the stimulation period (top panel) and bars represent mean values (± SEM) (bottom panel). One-way ANOVA with Dunnett’s correction was used to determine statistical differences. Cell colonies of stimulated cells were compared to unstimulated cells. *P < 0.05

