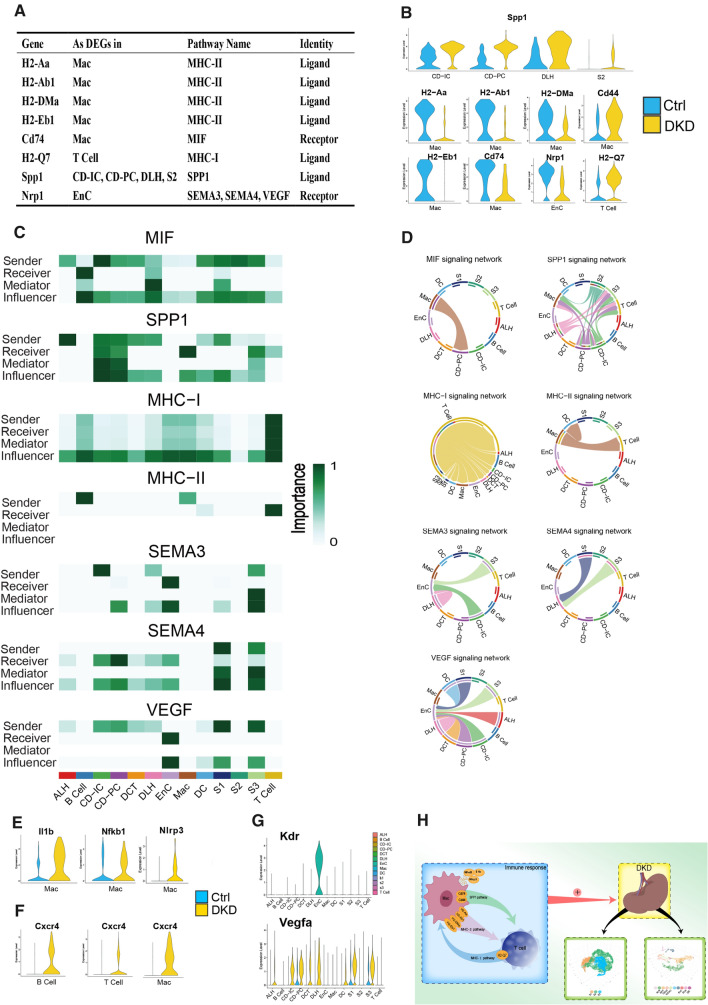
Fig. 6.
Cell communication in kidneys of db/db mice. A. The table shows the names of cell signaling pathways, source cell types and roles that DEGs participated in cell communication. B. The expression levels of DEGs involved in cell communication in corresponding cells between the two groups. C. Calculative contribution and importance of each ligand-receptor pair to the overall communication, which reflect the total communication role of every cell type in these signaling pathways by heatmap. D. Intercellular signaling pathways of these DEGs were displayed in chord chart. E–G. Violin diagram of genes related to upstream or downstream of DEGs. F. Schematic diagram of T Cell and Mac participating in Cell communication in DKD process

