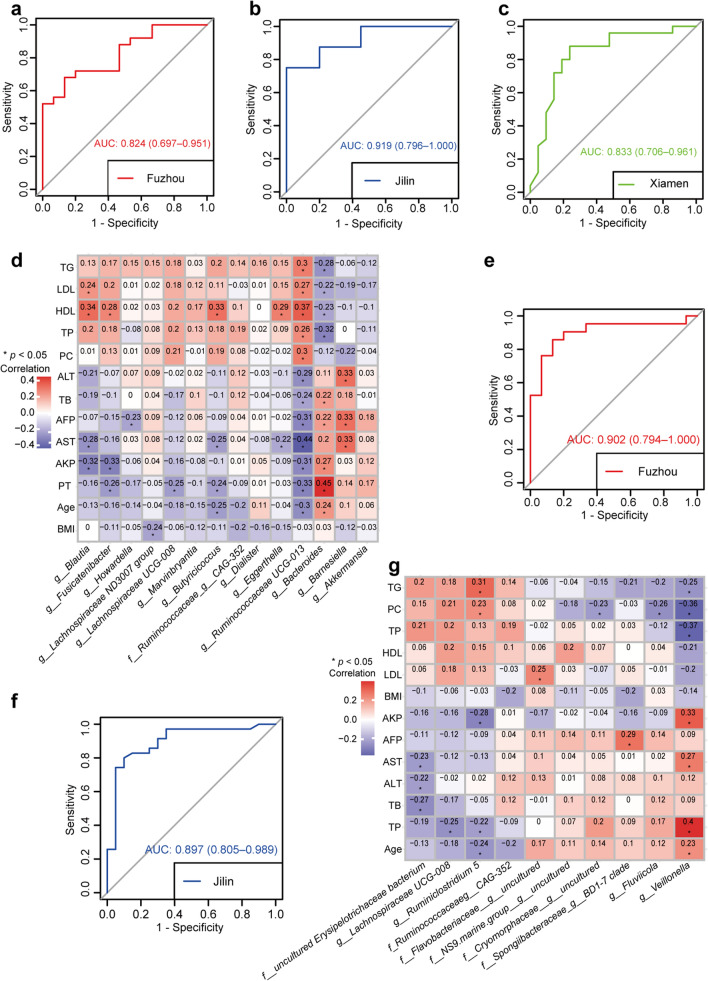
Fig. 4.
The performances of two RF models based on 14 LC-associated genera or 10 HCC-associated genera. a–c ROC curve of the RF model based on 14 LC-associated genera in Fuzhou, Jilin and Xiamen samples. d The heatmap of the relationships between 14 LC-associate genera and 13 clinical indicators. e–f ROC curve of the RF model based on 10 HCC-associated genera in Fuzhou and Jilin samples. g The heatmap of the relationships between 10 HCC-associated microbial genera and 13 clinical indicators

